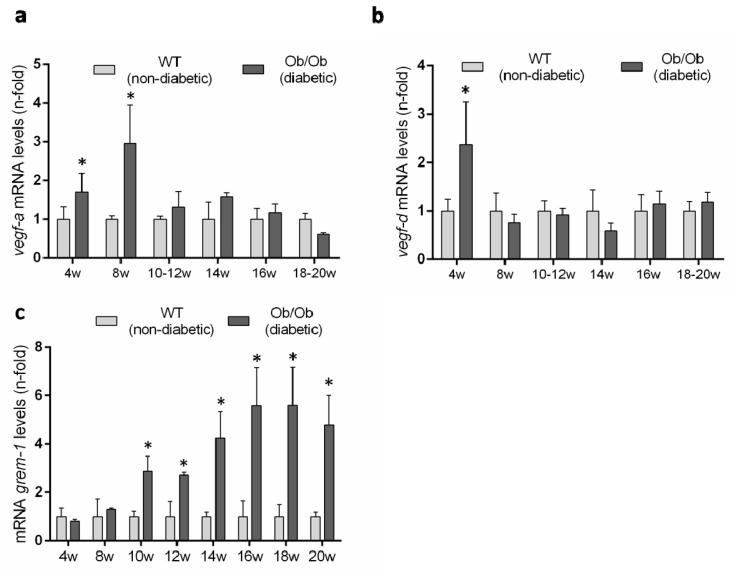
Figure 8.
Gene expression levels of VEGFR ligands in the BTBR ob/ob experimental model. (a) vegf-a, (b) vegf-d and (c) grem-1 were evaluated by a real-time polymerase chain reaction. mRNA levels in each sample were normalized by cyclophilin 1. Occurring at each time point, data were normalized by the mean value of their corresponding controls. Data as mean ± SEM of 6–8 mice per group. * p < 0.05 versus control non- diabetic, # p < 0.05 versus diabetic.

