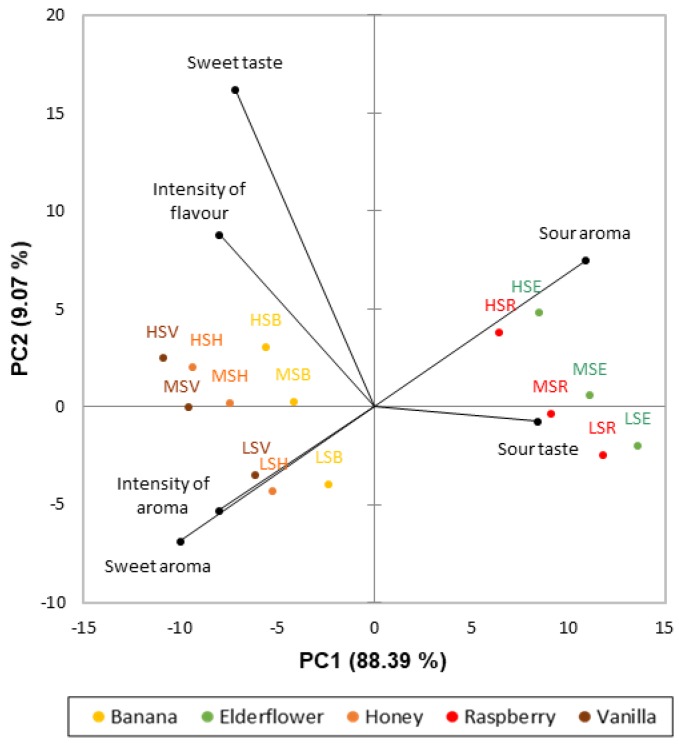
Figure 2.
Principal Component Analysis biplot of the results from the DA. Attributes are marked in black while samples are colored according to aromas and coded according to sucrose concentration: LS = low sucrose concentration, MS = medium sucrose concentration, HS = high sucrose concentration, and aroma type: B = banana aroma, E = elderflower aroma, H = honey aroma, R = raspberry aroma, and V = vanilla aroma.

