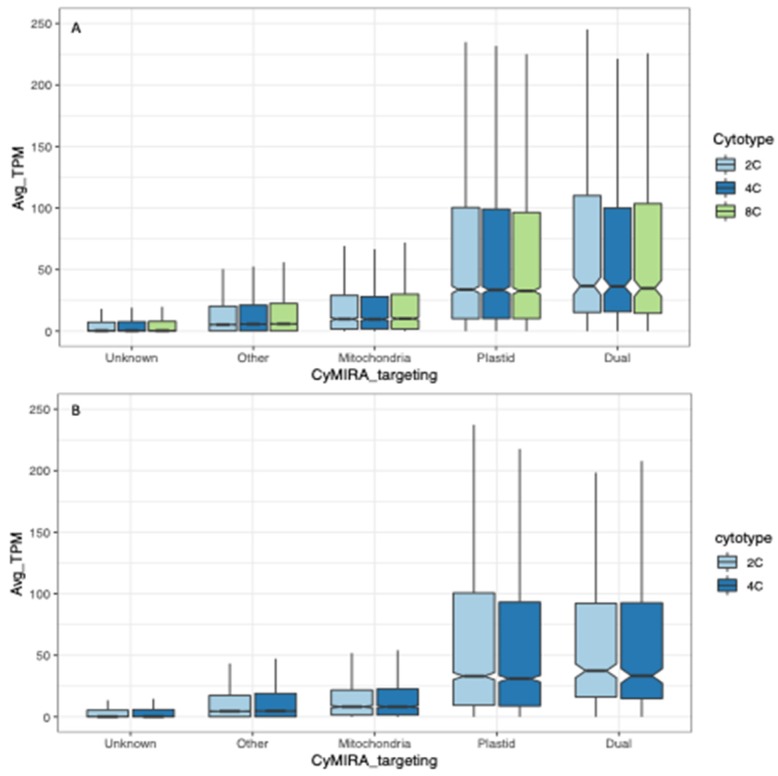
Figure 2.
Expression level by subcellular target (obtained from the CyMIRA database) for nuclear genes in diploids (2C), tetraploids (4C) and octoploids (8C). (A) Sepals. (B) Leaves. For each cytotype, average transcripts per million (TPM) per locus was calculated for the 3–4 biological replicates per cytotype, and the distribution of these average values (Avg TPM; y-axis) was plotted by targeted compartment (x-axis).

