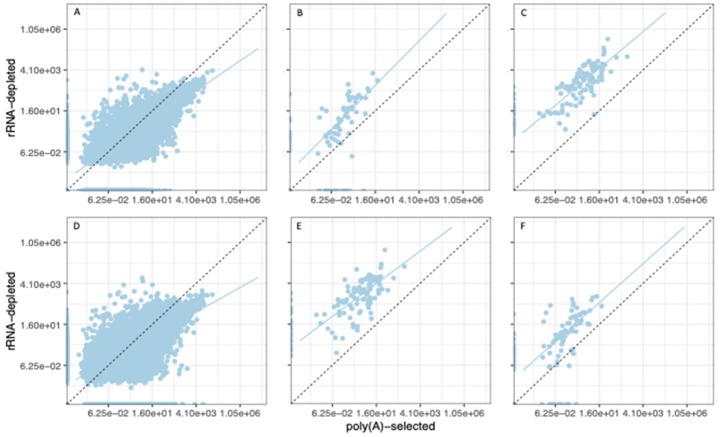
Figure 5.
Scatterplots of expression estimates (TPM) from rRNA-depleted libraries vs. poly(A)-selected libraries. (A–C) Control libraries from SRA BioProject PRJNA380344. (D–F) Control libraries from SRA BioProject PRJNA437291. (A,D) Nuclear genes. (B,E) Plastid genes. (C,F) Mitochondrial genes. Dashed lines indicate unity (equal expression estimates). Solid lines are the line of best fit to the data.

