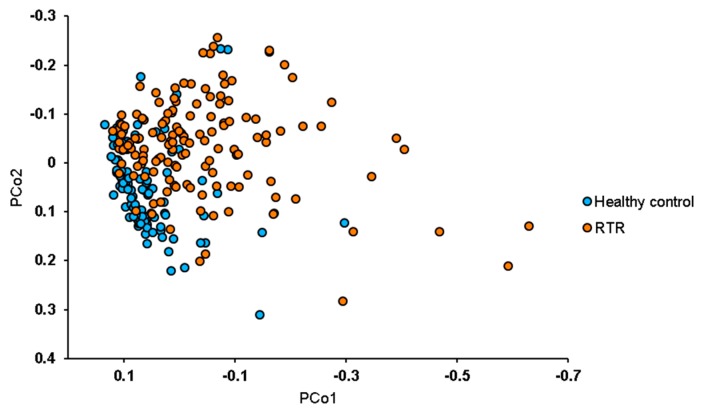
Figure 2.
Principal coordinate analysis of 139 RTRs and 105 healthy controls. The principal coordinates plot shows principal coordinates for the Bray–Curtis distance, a measure for the composition of the gut microbiome, for RTRs and healthy controls. Separation in the composition of the gut microbiome between RTRs and healthy controls can be observed. PCo1 is principal coordinate 1 and PCo2 is principal coordinate 2. The gut microbiome of RTRs is significantly different from that of healthy controls in the first coordinate (PCo1 vs. PCo2: p < 0.01). RTR or healthy control status significantly explained 5.8% of variation in the gut microbiome (p < 0.001).

