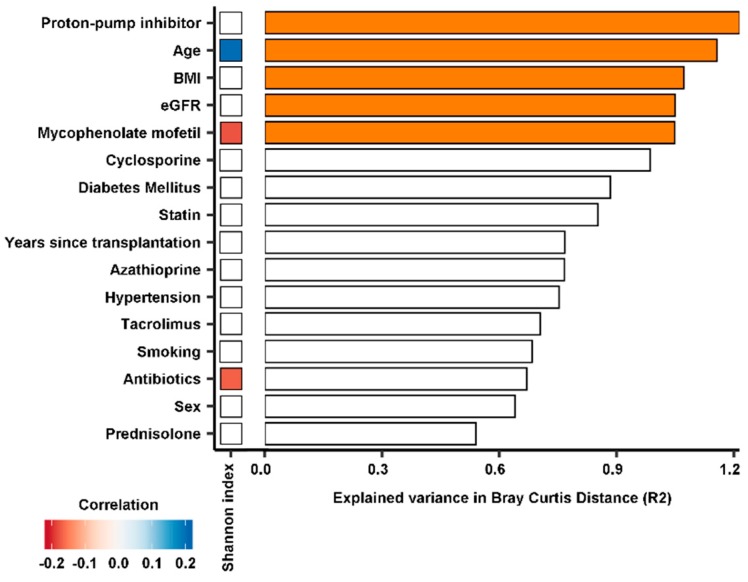
Figure 3.
Depiction of variables that are associated with variation in the gut microbiome within RTRs. In the bar plots, the x-axis represents the percentage of explained variance in the gut microbiome of RTRs expressed as the Bray–Curtis distance. The heatmap depicts significant negative correlations (red) and positive correlations (blue) with the Shannon diversity index (p < 0.01). These variables were tested only in the gut microbiome of RTRs. Bars in orange represent variables which significantly explain variance in gut microbiota composition (p < 0.05).

