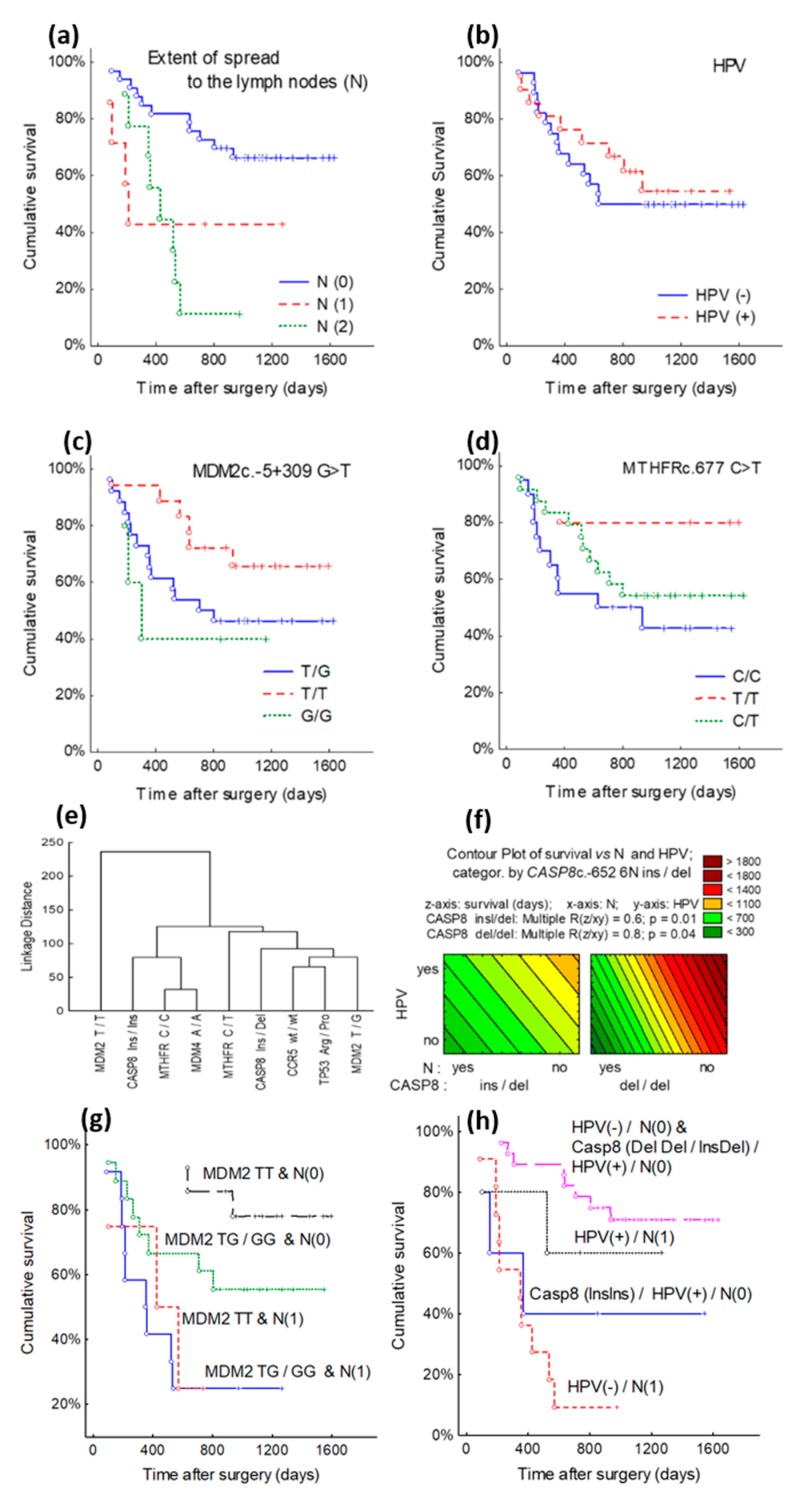
Figure 2.
Cancer patient survival curves according to genes SNPs, Lymph Node and human papiiloma virus (HPV): Patients’ survival rates: (a) Lymph Node (N0-2) (p = 0.01); (b) HPV+/- (p = 0.59); (c) MDM2 G > T gene with T/T, T/G and G/G polymorphisms (p = 0.13); (d) MTHFR C > T gene polymorphic C/T, C/C and T/T variants (p = 0.27); (e) SNP clustering on the average survival median (q1–q3) and mortality rates. Euclidian distances and Ward’s method were used for groups merging: (f) SNP’s and clinical parameters contour plot and multiple regresijon analysis. (g,h) laryngeal cancer patient survival curves according to genes SNPs, N, and HPV. Patients’ survival rates: (p = 0.004); (p ≤ 0.001).

