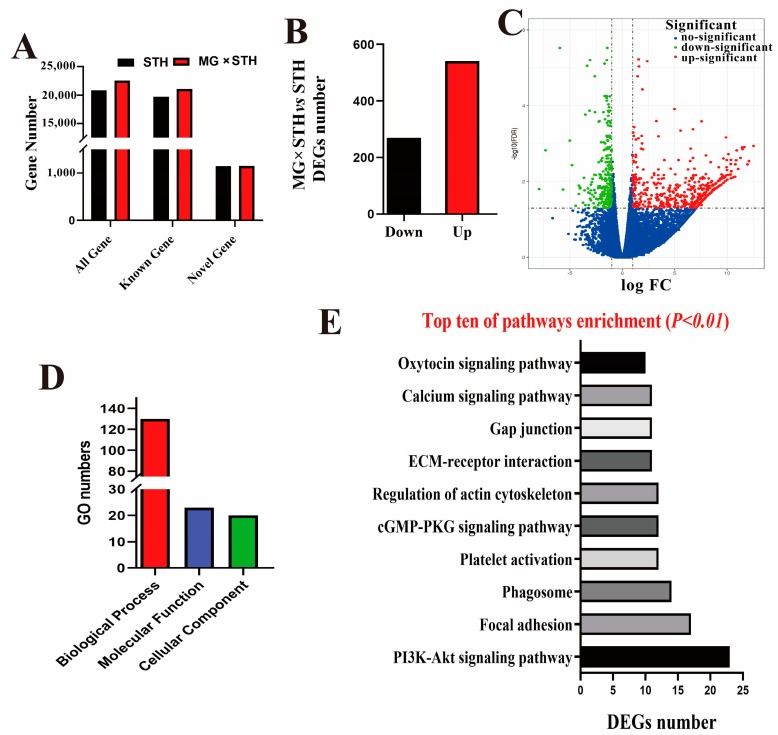
Figure 2.
Identity and functional analysis of the differentially expressed genes (DEGs) from longissimus dorsi tissues in the MG × STH and STH sheep. (A) Total number of genes identified by transcriptome sequencing in the two sheep groups. (B) The number of DEGs compared to the STH sheep. (C) Volcano plot of the DEGs. (D) The significant gene ontology (GO) numbers of cellular components, molecular functions, and biological processes (p < 0.05). (E) Top 10 most significant pathways according to the DEGs in the two sheep groups (p < 0.05), where the x axis represents the number of DEGs.

