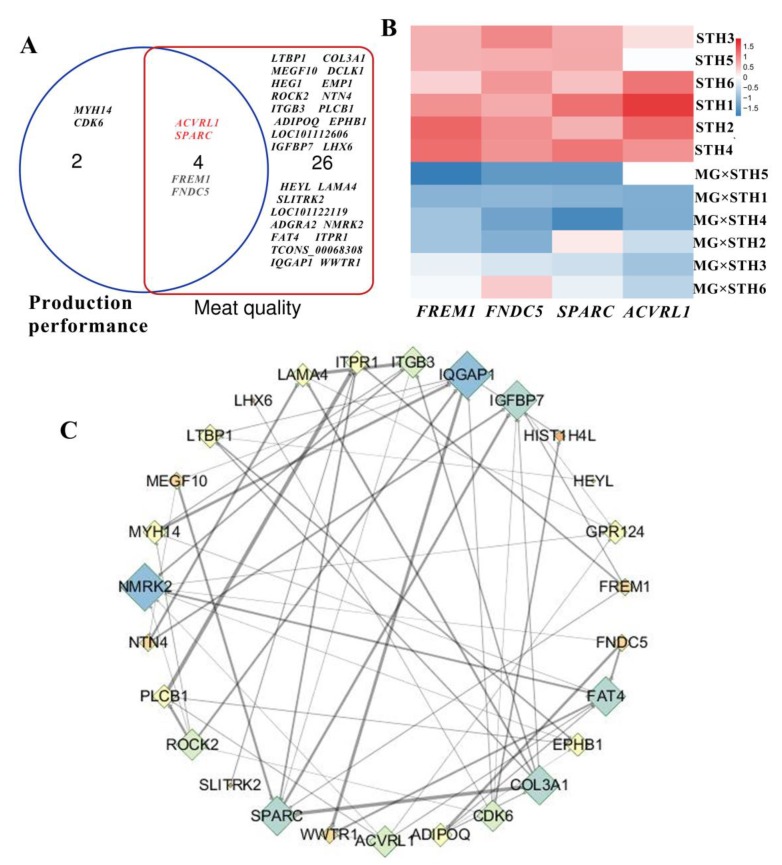
Figure 5.
Gene co-expression analyses of targeted DEGs related to sheep production performance and meat quality. (A) A Venn diagram of DEGs with Pearson correlation coefficient thresholds >0.75 or <−0.75 related to production performance and meat quality. (B) A heatmap of four DEGs related both to production performance and to meat quality. (C) The gene co-expression network of targeted DEGs (>0.75 or <−0.75) related to sheep production performance and meat quality.

