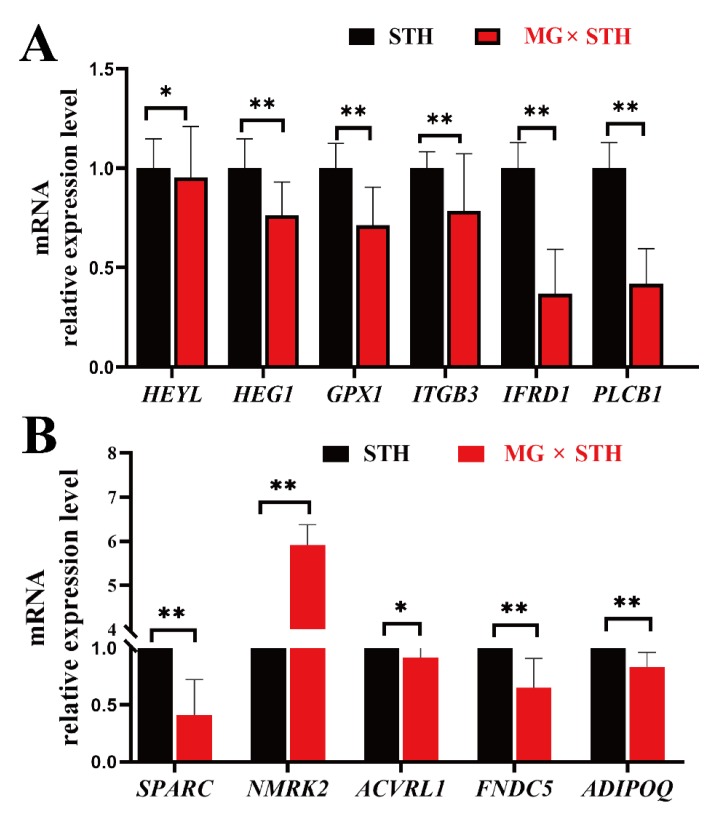
Figure 6.
Validation of 11 target DEGs in terms of transcriptome and correlation analysis data. (A) qRT-PCR analysis of six DEGs validated for transcriptome data. (B) qRT-PCR analysis of five DEGs validated for trait-associated correlation analysis data. The values were calculated using the 2−ΔΔCt method: * p < 0.05, ** p < 0.01.

