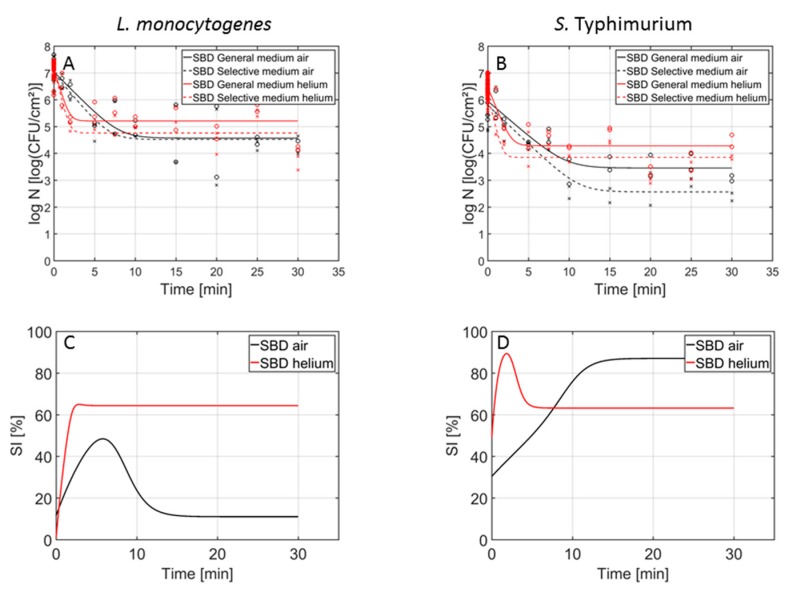
Figure 2.
Cell density (log10 (CFU/cm2)) of the 1-day-old (A) L. monocytogenes and (B) S. Typhimurium single-species model biofilms as function of the CAP treatment time using an air-based (black) or helium-operated (red) (SBD) CAP system (n = 3). Both the experimental data (symbols) and the global fit (line) of the Geeraerd et al. [25] model are represented: total viable population on general medium (o, solid line) and uninjured viable population on selective medium (x, dashed line). The percentage of sub-lethally injured cells (SI) as function of the CAP treatment time have been included as well for the (C) L. monocytogenes and (D) S. Typhimurium single-species model biofilms using an air-based (black) or helium-operated (red) CAP system.

