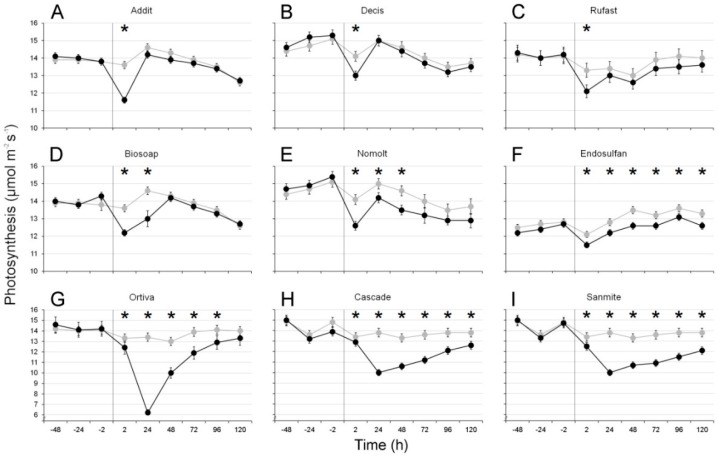
Figure 1.
Mean ± SE photosynthetic rates (μmoL CO2 m−2 s−1) of sweet pepper leaves before and after treatment with nine different pesticides. Gray curves refer to control plants; black curves indicate treated plants. The moment when each treatment was conducted is indicated by a vertical line (i.e., time = 0). * Indicates significant differences (p < 0.05) between treatments at a given time.

