Figure 11.
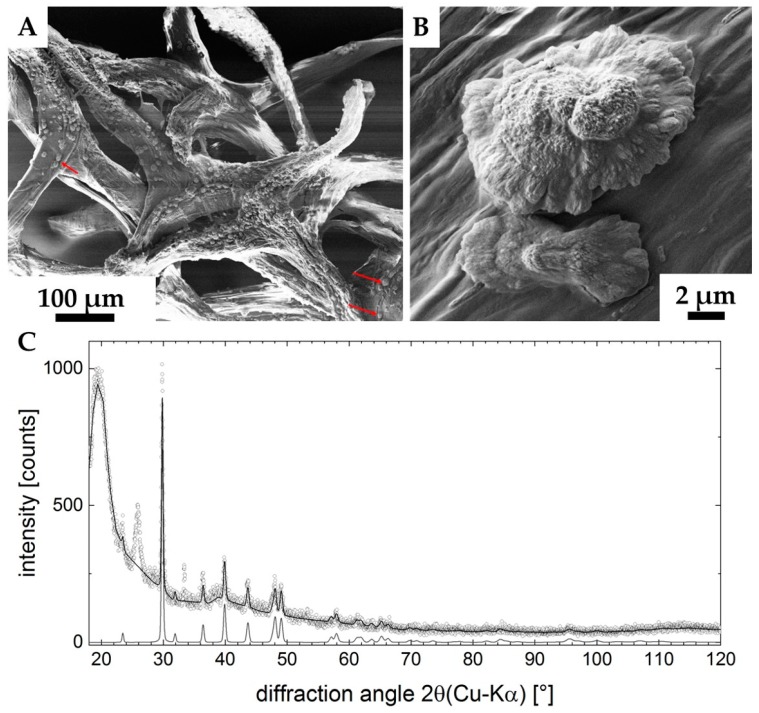
SEM images (A,B) of the ex vivo mineralized surface of 3D chitinous scaffold confirm the presence of microcrystallites (arrows). X-ray diffraction pattern of the sample is represented in the image C. Measured data are open dots; the refinement is highlighted by the solid line. The diffractogram of calcite-CaCO3 is shown at the bottom, clearly verifying the presence of this phase in the sample. Two unassigned peaks remain in the data (2θ ≈ 27°, 2θ≈ 33°). The large feature at 2θ ≈ 20° indicates a high content of amorphous material in the sample (C).

