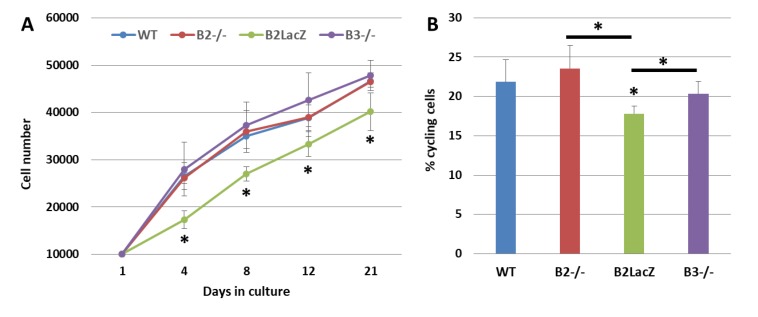
Figure 3.
Growth curves and cell proliferation of both WT (wild type) and Eph-B-deficient BM-MSCs. (A) Cell content (×106) of WT and Eph-B-deficient MSCs at different days of culture. Note the significant reduced cellularity of Eph-B2-LacZ MSCs. (B) Percentage of cycling cells in the different cultures. Lower cell proportions occurred in the Eph-B2-LacZ cultures as compared to the other ones (* p value < 0.05) (n = 5).

