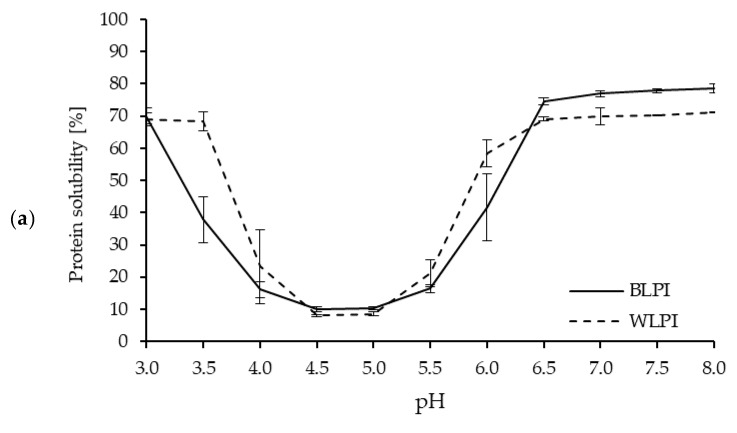
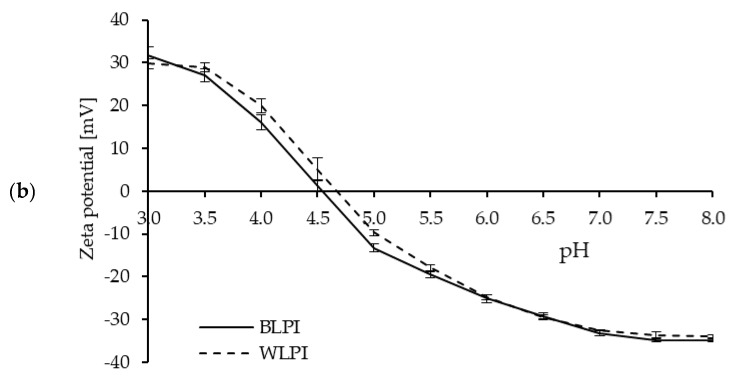
Figure 4.
Protein solubility (a) and zeta potential (b) as a function of pH for BLPI and WLPI (error bars show standard deviation). Significant differences (p < 0.05) were found between BLPI and WLPI for protein solubility (a) at pH 3.5, 4.5, 5, 6.5, 7, 7.5 and 8, and for zeta potential (b) at pH 5, 7.5 and 8.


