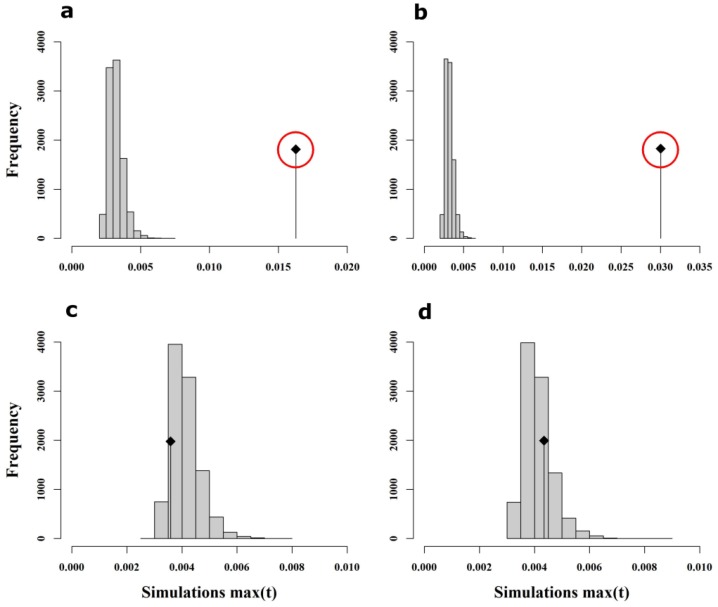
Figure 5.
Results of Monte Carlo simulations using wing shape data. The x-axis represents max(t) calculated in each permutation whereas the y-axis represents the frequency of each max(t) class. The observed max(t) value is represented by the vertical black line with the black square on top. Monte Carlo simulations support the existence of global structure for both sexes (a-drones; b-workers) but not local structure (c-drones; d-workers), as indicated by the location of the observed max(t) value outside (a,b) or inside (c,d) the histogram of simulated values. Outside locations of observed max(t) values specify statistical significance (indicated by the red circle).

