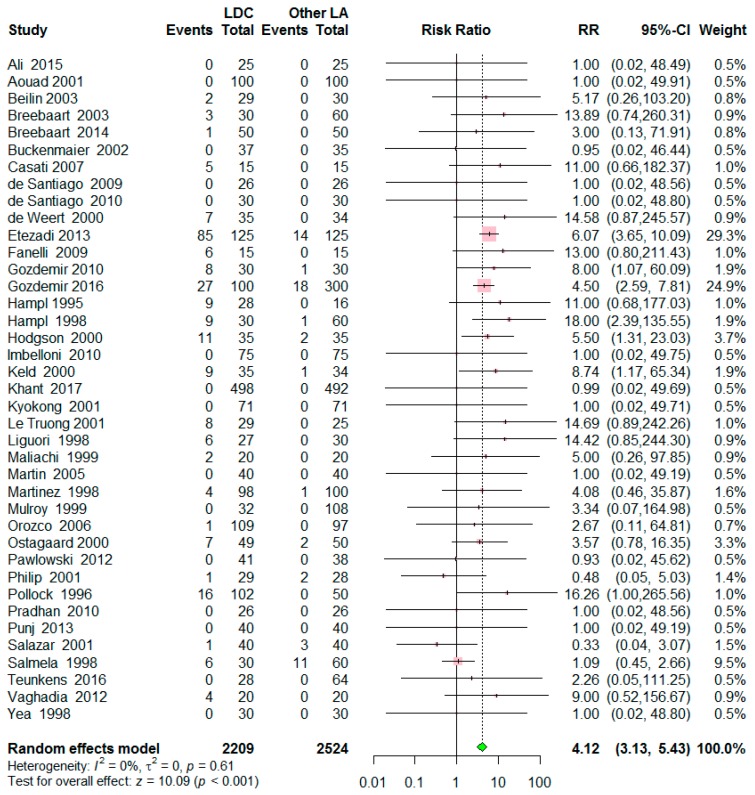
Figure 3.
Forest plot for the risk of transient neurologic symptoms (TNS) after spinal anesthesia with lidocaine versus other local anesthetics. The incidence of TNS 10.8 % in the lidocaine group while 2.2% in the control group. The risk of TNS was significantly higher in the lidocaine group than in the control group (p < 0.001). Abbreviations: LDC = lidocaine, LA = local anesthetics, RR = risk ratio, CI = confidence interval.

