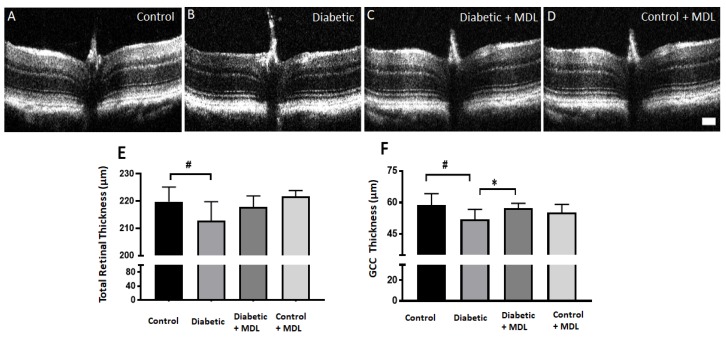
Figure 4.
Analysis of diabetes-induced retinal thinning. (A–D) Representative images (B-scan) obtained from the spectral domain optical coherence tomography (SD-OCT) analysis of control, diabetic, MDL 72527-diabetic and MDL 72527-treated control retinas. (E–F) Quantification of the retinal thickness (from NFL to outer segment/RPE interface) and thickness of the ganglion cell complex (RNFL+GCL+IPL) showing a significant decrease in diabetic retinas compared to controls. MDL 72527 treatment significantly improved diabetes-induced thinning of the inner retina. Results presented as mean ± SD. N = 5–12 per group. # p < 0.01, * p < 0.05. scale bar 100 µm.

