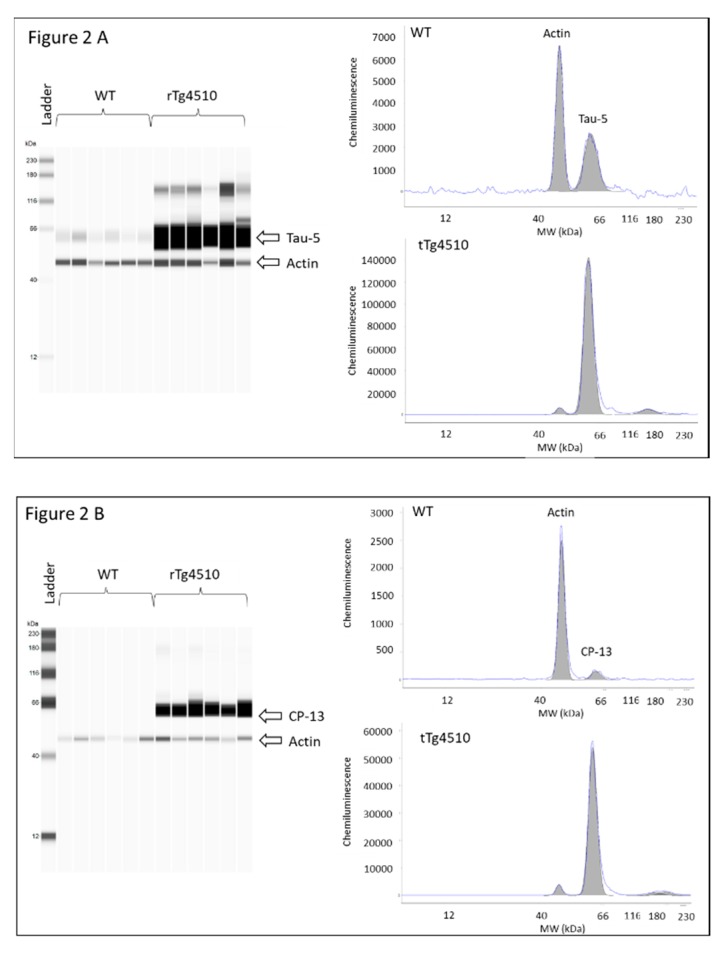
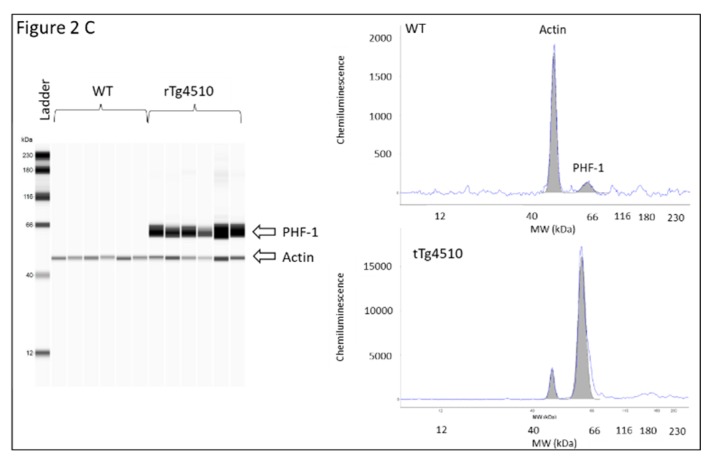
Figure 2.
Levels of total tau and phosphorylated tau in brain cortex tissue from 4 months-old WT and rTg4510 mice; (A) total tau; (B) CP13; and (C) PHF1. Left panel virtual western blot; right panel representative pherogram of brain cortex from a WT and rTg4510 mouse. Similar profiles were found for all WT and rTg4510 mice used in the study.


