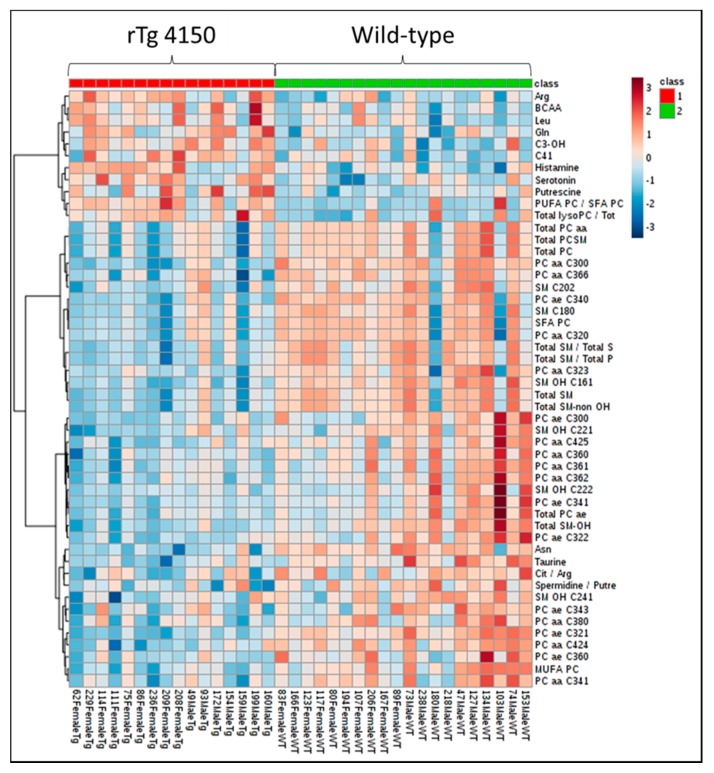
Figure 3.
Profile of metabolites in brain samples from WT and rTg4510 mice. The heat map illustrates the levels of the top 50 metabolites that are significantly altered. The color scale on the right side of the map indicates increasing concentrations (red spectra) or decreased concentrations (blue spectra).

