Fig. 4.
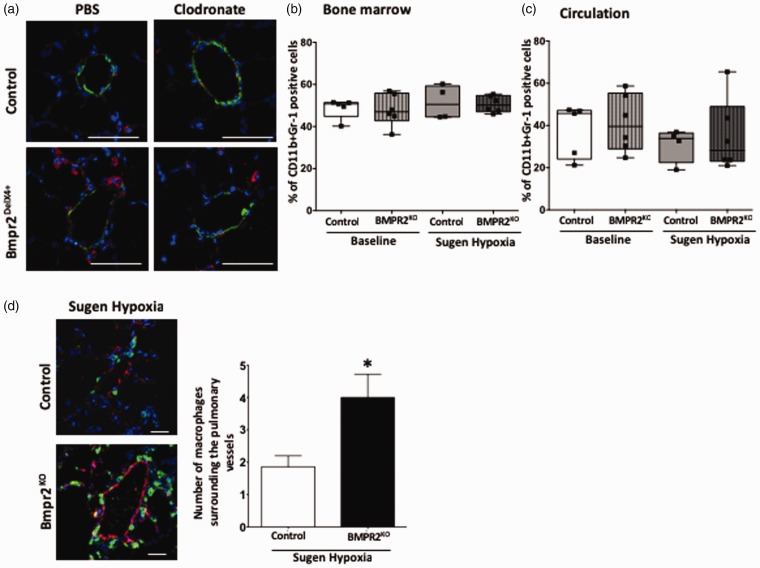
Suppressed BMPR2 expression in macrophages drives macrophage localization in pulmonary vessels in mouse model of PH: (a) Immunofluorescence staining for CD68-positive macrophages (in red) and smooth muscle actin (in green). Nucleus is stained blue (magnification 900×, scale bar 50 uM). (b, c) Number of CD11b+Gr-1-positive cells in bone marrow and in circulation (plasma). (d) Immunofluorescence staining for vWF (in red) and macrophages are green in color (by lineage tracing). Nucleus is stained blue (magnification 600×, scale bar 50 uM). *P < 0.01 control (LysM Cre mice) (sugen/hypoxia) vs. BMPR2Het (LysM Cre BMPR2-KO mice). Bar graph represents number of macrophages surrounding the pulmonary vessels in control and BMPR2KO mice following sugen/hypoxia treatment.

