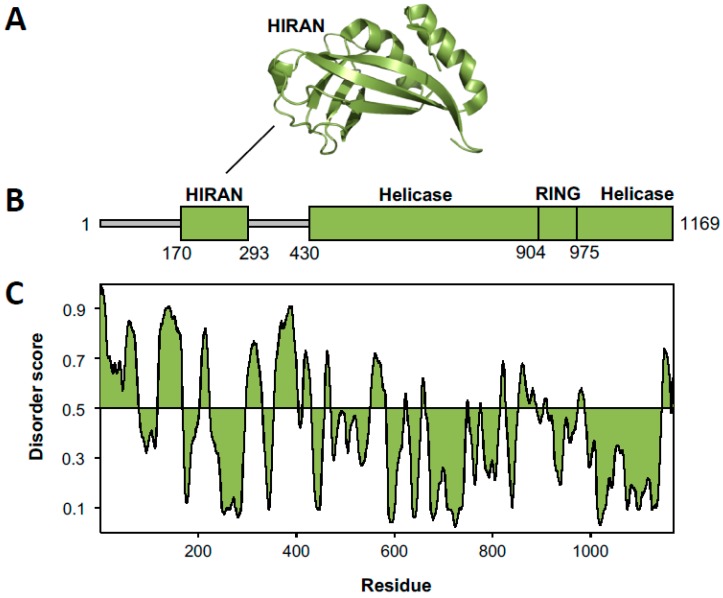
Figure 4.
Structure of Rad5. (A) Ribbon diagram of the Rad5 HIP116 Rad5p N-terminal (HIRAN) domain (green) (4XZG.pdb) [68]. (B) A linear diagram of Rad5 shows the structured domains as thick, green rectangles and the intrinsically disordered regions as thin, grey rectangles. (C) A disorder plot of Rad5 was generated using the Protein Disorder Prediction Server [46].

