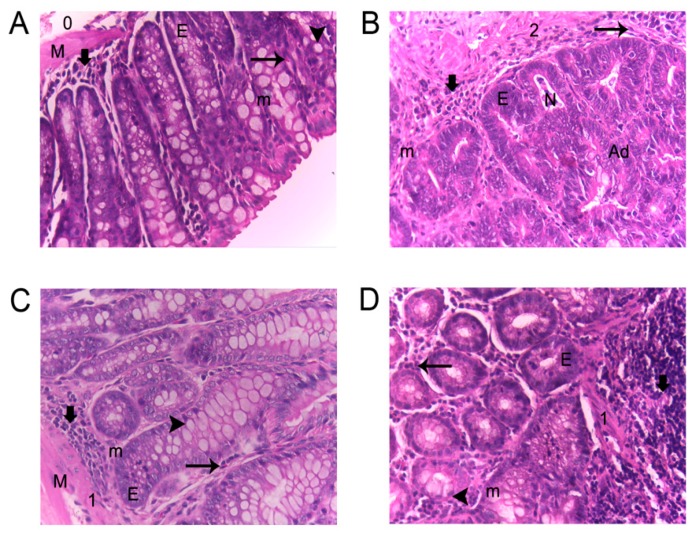
Figure 2.
Histopathological features of colonic mucosa of AOM + DSS-treated mice. H&E staining: (A) Normal group, (B) AOM + DSS group, (C) AVA + AOM + DSS group, (D) SO + AOM + DSS group. n = 8–10 mice per group. ( ) Lymphocyte infiltration; (
 ) eosinophils; (
 ) goblet cells; (E) epithelial ridges; (M) defined muscularis; (m) mitosis; (N) necrosis; (0,1,2) inflammation grade; and (Ad) adenocarcinoma.

