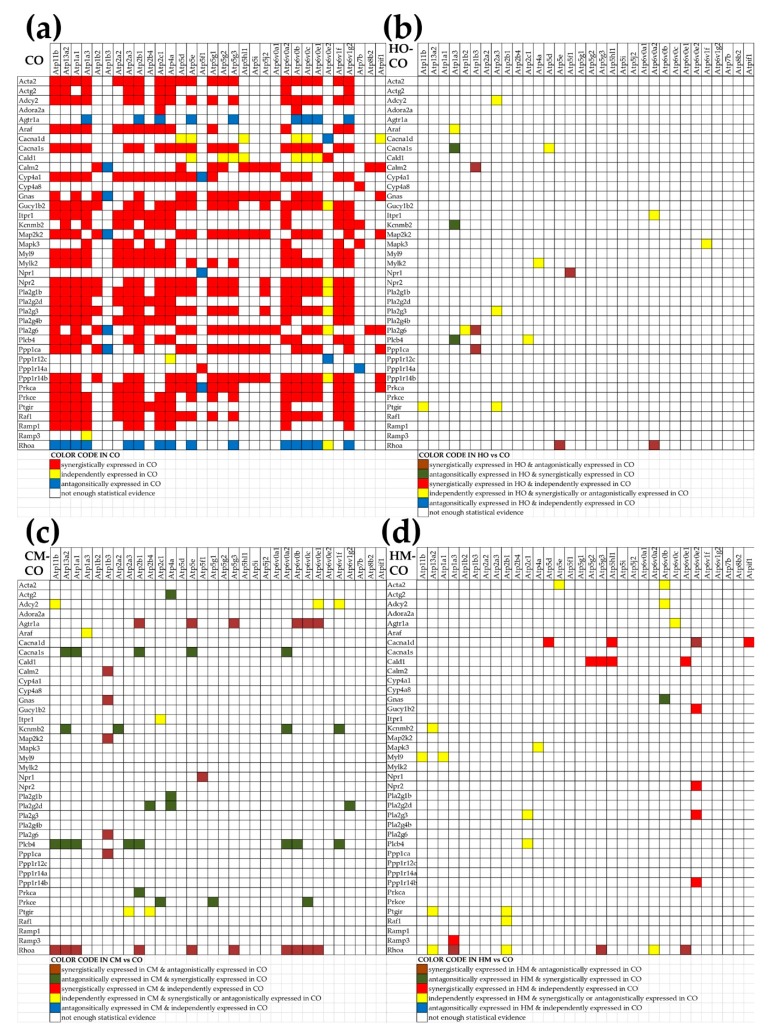
Figure 5.
Synergistically (red squares), antagonistically (blue squares), and independently (yellow squares) expressed pairs of VSMC genes and ATPases in CO (a) whose expression correlation was significantly altered by hypoxia (b), monocrotaline (c), or the combined action of hypoxia and monocrotaline (d). A blank square in (a) indicates that the correlation is not (p < 0.05) statistically significant.

