Figure 7.
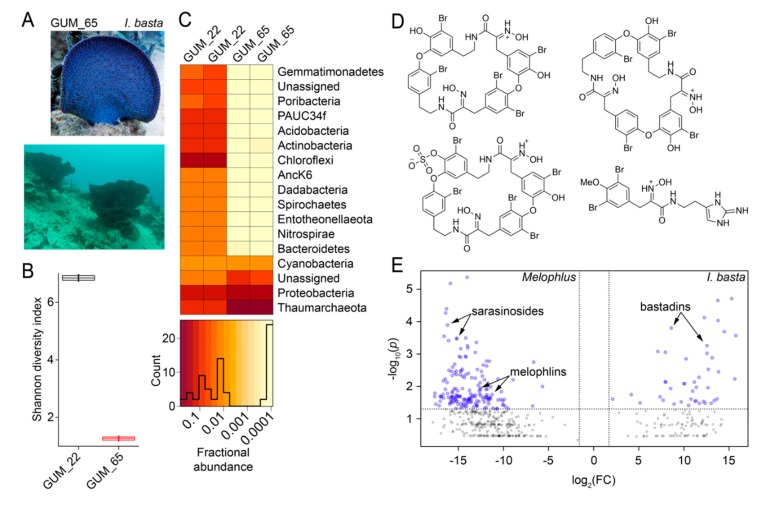
Microbiome and metabolome divergence between sponge geographical neighbors. (A) Morphology of Ianthella basta (top, specimen GUM_65) and the presence of I. basta sponges on the Apra harbor seafloor (bottom). (B) Shannon diversity indices for M. sarasinorum GUM_22 and I. basta GUM_65. (C) Relative abundance heatmap for microbiome amplicon sequence variants (ASVs) at the phyla level for technical replicates of GUM_22 and GUM_65. The histogram demonstrates ASV abundances. (D) Representative polybrominated natural products detected in the I. basta metabolomes dereplicated using MarinLit. (E) Comparative two-dimensional distribution of metabolomic features mined using MZmine2 for the four Melophlus specimens used in this study (on left) against four biological replicates of I. basta (on right). Each sponge specimen was analyzed by LC/MS in duplicate. On the x-axis, on a log2 scale, is plotted the mean ratio fold-change (FC) for each metabolomic feature identified above a common MS1 abundance threshold. The y-axis represents the statistical significance p-value of the ratio fold-change for each metabolite (plotted on a log10 scale). Metabolomic features with p-value > 0.05 are colored grey.

