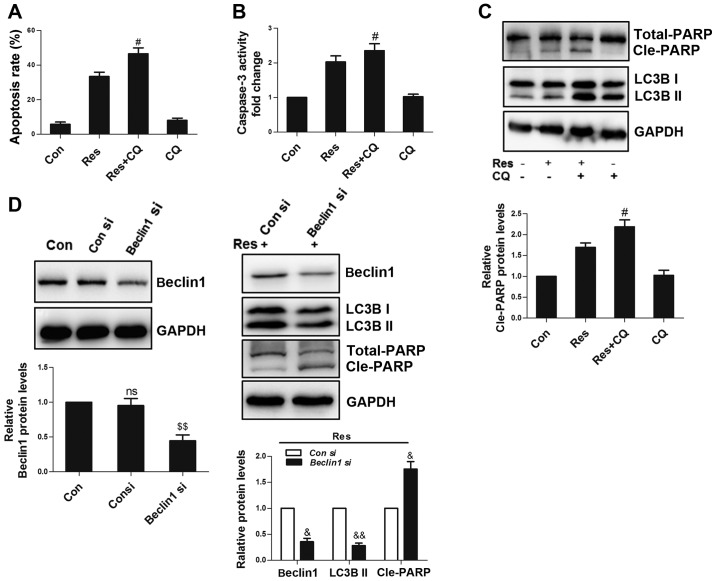
Figure 6.
Inhibition of autophagy enhances Res-induced apoptosis. Following treatment with 40 µM Res in the presence or absence of 50 µM CQ for 48 h, quantitative analysis of (A) apoptosis and (B) caspase 3 activity were detected by flow cytometry, and (C) via western blot analysis of PARP and LC3B. (D) Cells were transfected with 100 nM Beclin 1 siRNA or control siRNA, and non-transfected cells were set as a blank control. After 24 h, cells were treated with 40 µM Res for an additional 48 h, and western blotting was used for the analysis of Beclin 1, LC3B and PARP expressions. NS vs. control group; #P<0.05 vs. Res group; $$P<0.01 vs. con siRNA group; &P<0.05, &&P<0.01 vs. con siRNA+Res group. NS, not significant; Res, resveratrol; CQ, chloroquine; siRNA, small interfering RNA.

