
Figure 3.
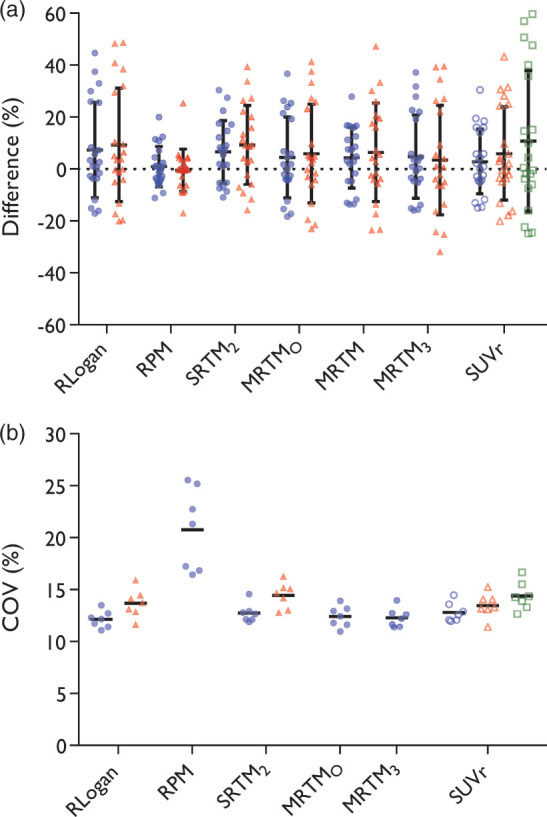
Filled circles represent the full 90 min dataset, filled triangles the first 60 min, open circles the time interval of 60–90 min, open triangles 40–60 min, open squares 20–40 min. (a) Accuracy; bars represent mean and standard deviation. Please note that the data points are from three regions inside the tumour for each subject, thus data can be correlated. MRTM2 and MRTM4 were excluded from this figure. (b) Noise estimated in the DVR or BPND+1 maps; bars represent mean. RPM60, , MRTM, MRTM2, and MRTM4 were excluded from this figure to more clearly show differences between the remaining methods.