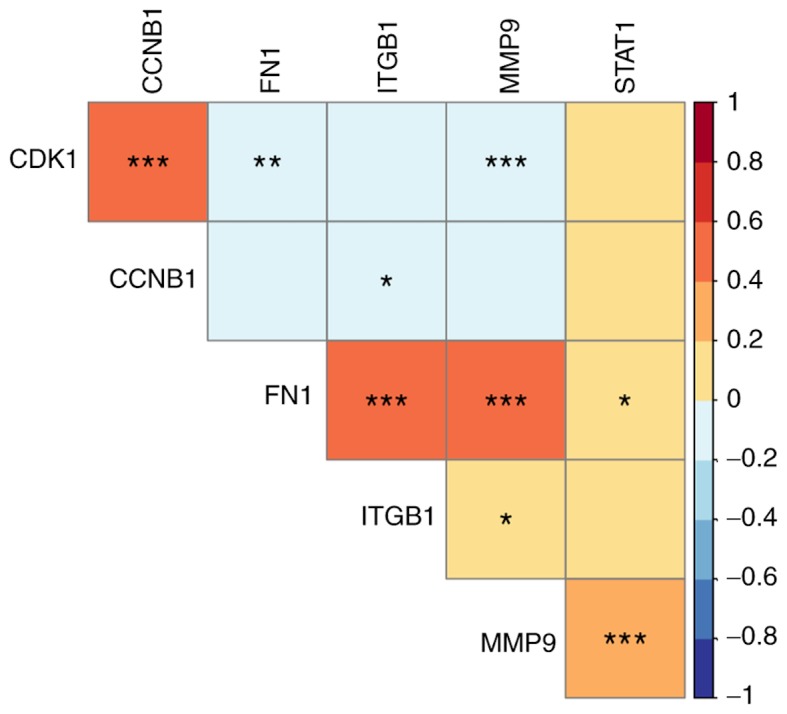
Figure 6.

Co-expression analyses for the key genes. Positive correlation was detected between CDK1 and CCNB1; between FN1 and ITGB1, and MMP9, and between STAT1 and MMP9. Color in each grid represents the correlation coefficient between two genes. The values in the color legend represent the correlation coefficient. *P<0.05, **P<0.01, ***P<0.001.
