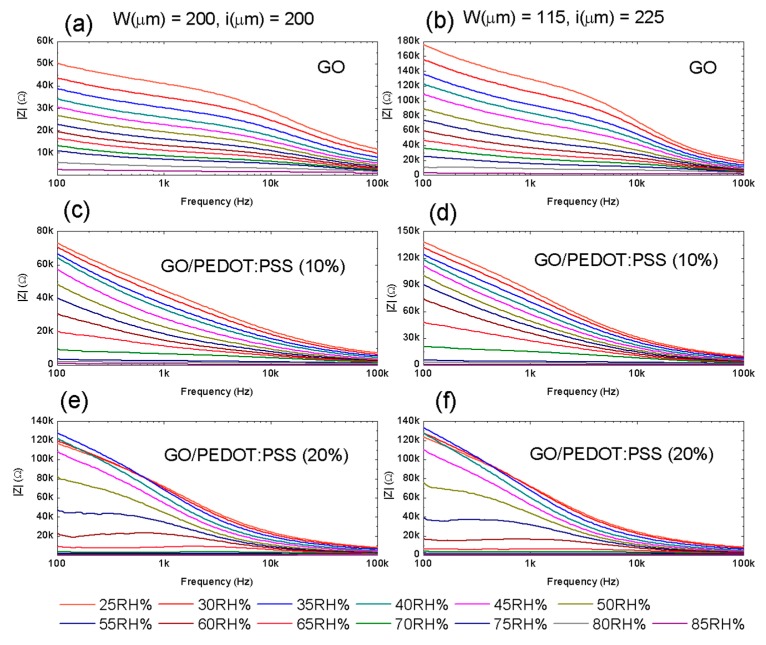
Figure 4.
Absolute value of the impedance as a function of the frequency for the different values of RH. The left column presents the results obtained for layout 1 using the three different sensitive layers: (a) GO; (c) GO/PEDOT:PSS (10%); (e) GO/PEDOT:PSS (20%). Likewise, the right column presents the result of layout 2 for the same sensitive layers: (b) GO; (d) GO/PEDOT:PSS (10%); (f) GO/PEDOT:PSS (20%).

