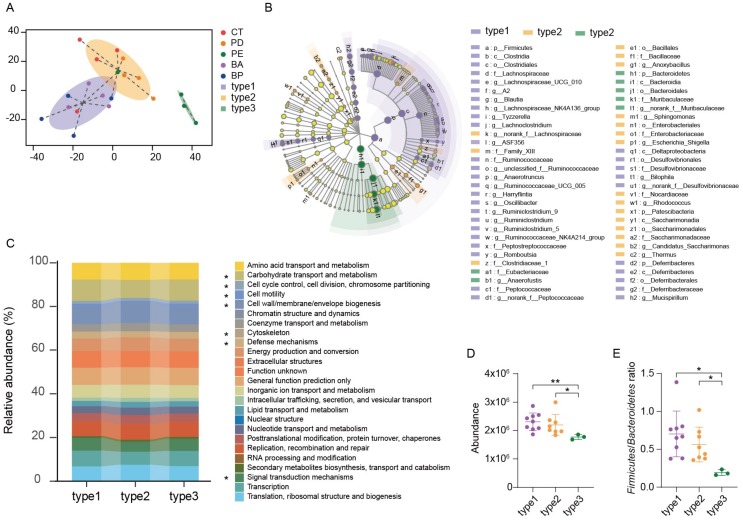
Figure 4.
Enterotype analysis and functional differences between different enterotypes. (A) Gut microbiome was clustered into three enterotypes at OTU-level using Jensen–Shannon distance, and the graphs for enterotype clusters indicate the first two principal coordinates. (B) Linear discriminant analysis effect size (LEfSe) was used to differentiate the three enterotypes. (C) PICRUSt prediction of functional profiling of the microbial communities from these three enterotypes based on the 16SrRNA gene sequences. (D) Difference in the function of carbohydrate transport and metabolism and (E) The Firmicutes to Bacteroidetes ratio were tested using Student’s t-test, * p < 0.05, ** p < 0.01.

