Figure 1.
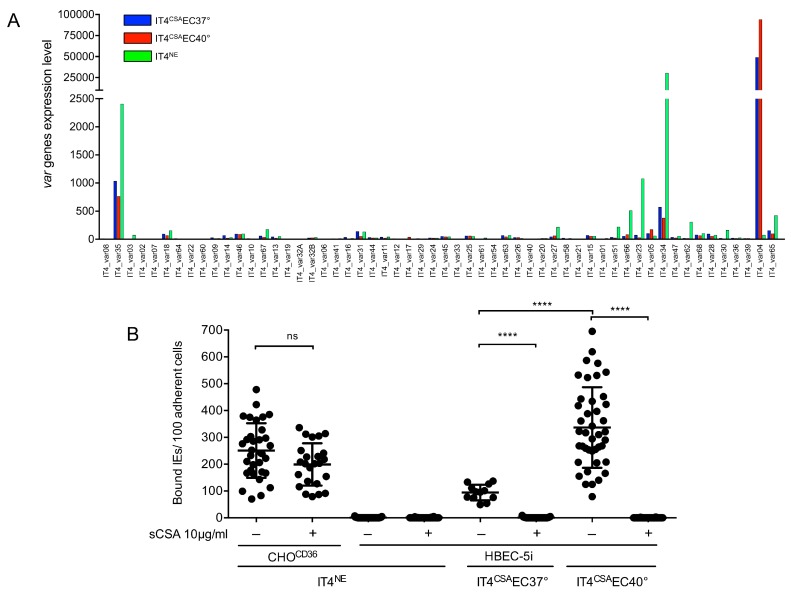
Var expression profile of IT4 populations enriched for binding to HBEC-5i cells at 37 °C and 40 °C, and binding capacity of different IT4 populations to CHOCD36 and HBEC-5i cells. (A) Expression profile of all var genes in IT4 populations enriched for binding HBEC-5i cells at 37 °C and 40 °C (IT4CSAEC37° and IT4CSAEC40°) in comparison with long-term cultured IT4 parasites (IT4NE). The expression level is defined as the average of normalized read counts of four independent transcriptional analyses. (B) Binding capacity of IT4NE to transgenic CHO-475 cells expressing CD36 (CHOCD36) and HBEC-5i cells, and of IT4 parasites enriched for binding to HBEC-5i cells at 37 °C and 40 °C (IT4CSAEC37°, IT4CSAEC40°). Preincubations of IEs without (−) or with (+) 10 µg/mL sCSA is indicated. Each point represents one binding assay. IT4NE/CHOCD36: (-) n = 33, (+) n=24; IT4NE/HBEC-5i: (−) n = 42, (+) n = 32; IT4CSAEC37°/HBEC-5i: (−) n = 12, (+) n = 29; IT4CSAEC40°/HBEC-5i: (−) n = 27, (+) n = 36. Statistical significance was assessed by ordinary one-way ANOVA and Tukey’s post hoc test (ns p > 0.05; **** p < 0.0001).

