
Figure 4.
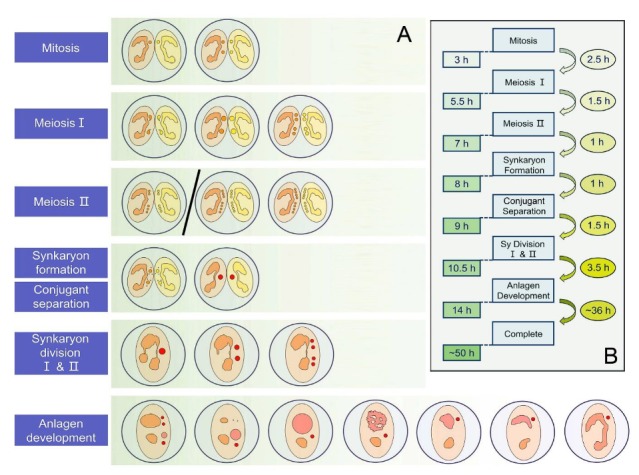
Summary of the nuclear events occurring during conjugation in Euplotes raikovi. (A) Schematic diagrams showing the nuclear events at each step of conjugation. (B) Time chart of each step of conjugation. The initial formation of mating pairs was taken as time 0 of the process. The number on the left indicates the time point from initial pair formation. The number on the right indicates the time taken by each step.