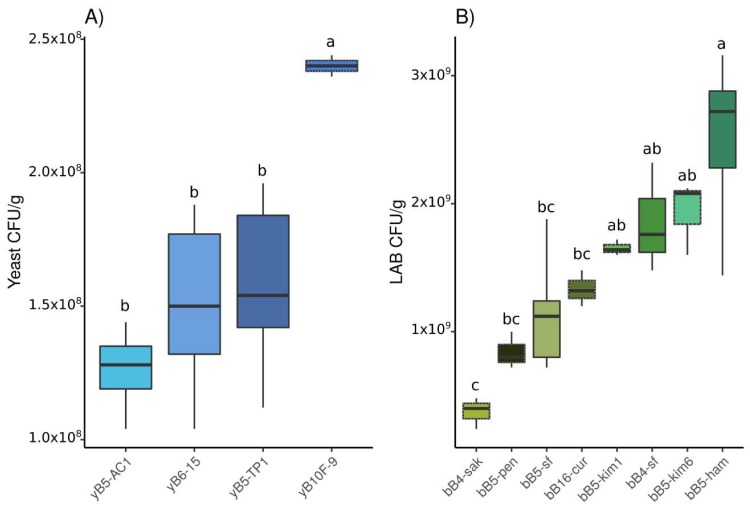
Figure 1.
Colony forming units per gram of dough (CFU/g) of (A) yeast strains in monoculture and (B) LAB strains in monoculture after 24 h. Compact letter display on top indicate Tuckey’s statistical groups. Blue was chosen for yeast strains; dashed lines indicate S. cerevisiae and plain lines K. humilis. Green was chosen for LAB strains, with obligately heterofermentative LAB in plain lines boxplots.

