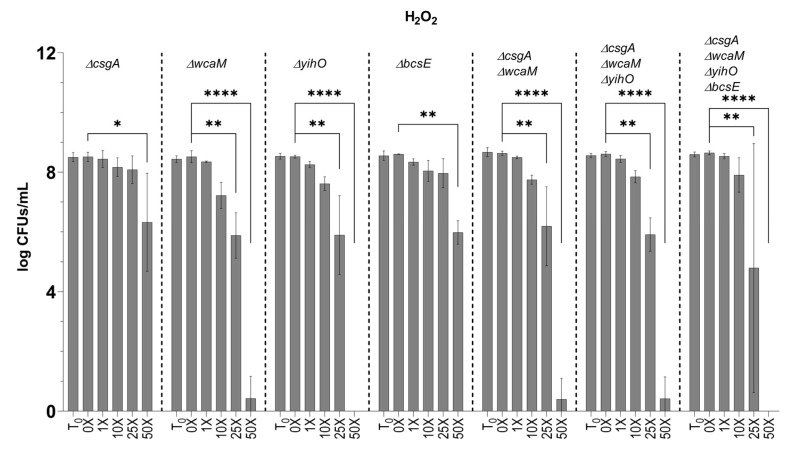
Figure 6.
Tolerance of EPS mutants to H2O2. Biofilm aggregates deficient in one or more EPS(s) were challenged with H2O2 at the same concentrations detailed above. S. Typhimurium ΔcsgAΔwcaMΔyihOΔbcsE data were used from Figure 5 for comparative purposes. Significance between CFUs determined by two-way ANOVA with Tukey multiple correction (*, p < 0.05; **, p <0.01; ****, p < 0.0001). Error bars indicate SD.

