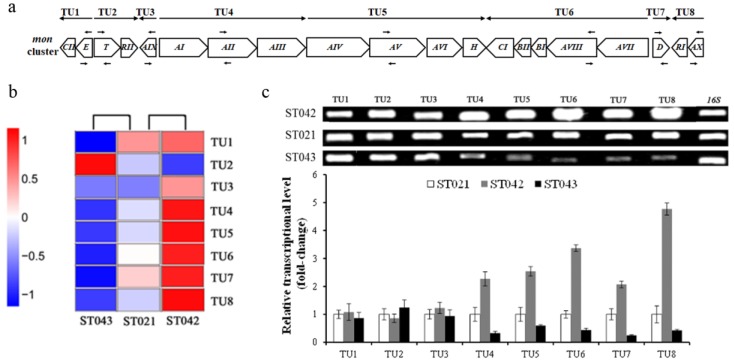
Figure 5.
RNA-Seq analysis and RT-PCR verification for transcription of mon cluster. (a) Transcription units (TUs) in monensin biosynthesis. (b) Heat map of clustering analysis of eight mon TUs by RNA-seq. Expression ratios are shown as log2 values. Red color represents increased expression, while blue color represents decreased expression. (c) Relative transcriptional levels of TUs in strains ST042 (grey column) and ST043 (black column) compared to strain ST021 (white column), which were set to 1.0 (arbitrary units) by RT-PCR. Error bars indicate standard deviations from three independent experiments.

