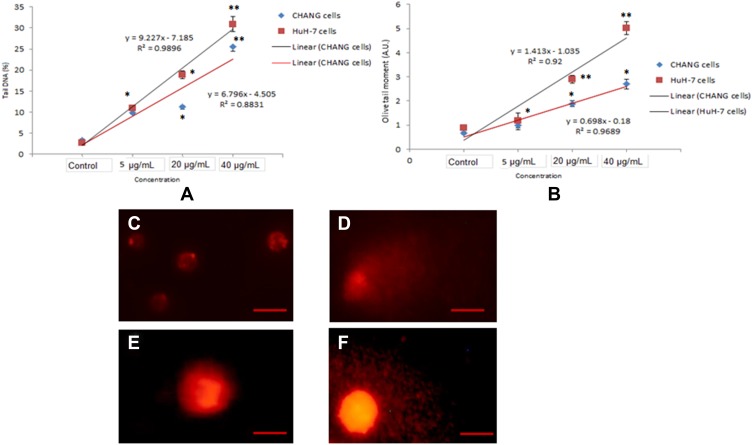
Figure 8.
Genotoxic effect of gAgNPs exposure to CHANG and HuH-7 cells (A). Tail DNA (%) (B). Olive tail moment. DNA damage photomicrograph of cells due to gAgNPs exposure (C). Control CHANG cells (D). CHANG cells exposed at 40 µg/mL gAgNPs (E). Control HuH-7 cells (F). HuH-7 cells exposed at 40 µg/mL gAgNPs. Each value represents the mean ±SE of three experiments. *p < 0.05 and **p < 0.01 vs control. Scale bar is 50 µm.

