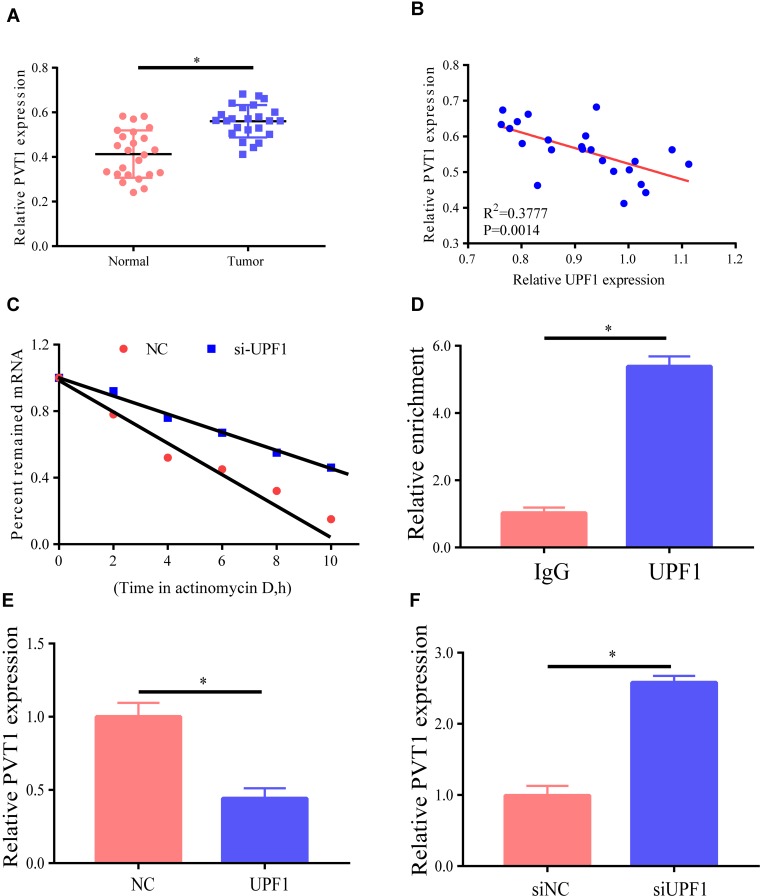
Figure 4.
LncRNA PVT1 links UPF1. (A) PVT1 expression is examined by RT-PCR, with GAPDH expression as normalization. (B) Association between expression levels of UPF1 and PVT1 RNAs in 24 EC tissues. (C) Actinomycin D is employed for cell treatment for the denoted time, and RT-PCR is implemented for the assessment of PVT1 RNA level. (D) RIP test denotes the linkage between UPF1 and PVT1. (E) UPF1 overexpression reduces PVT1 expression. HEC1A cells are treated with UPF1 plasmid. (F) UPF1 decrement in HEC1A cells raises PVT1 expression. (*P<0.05).

