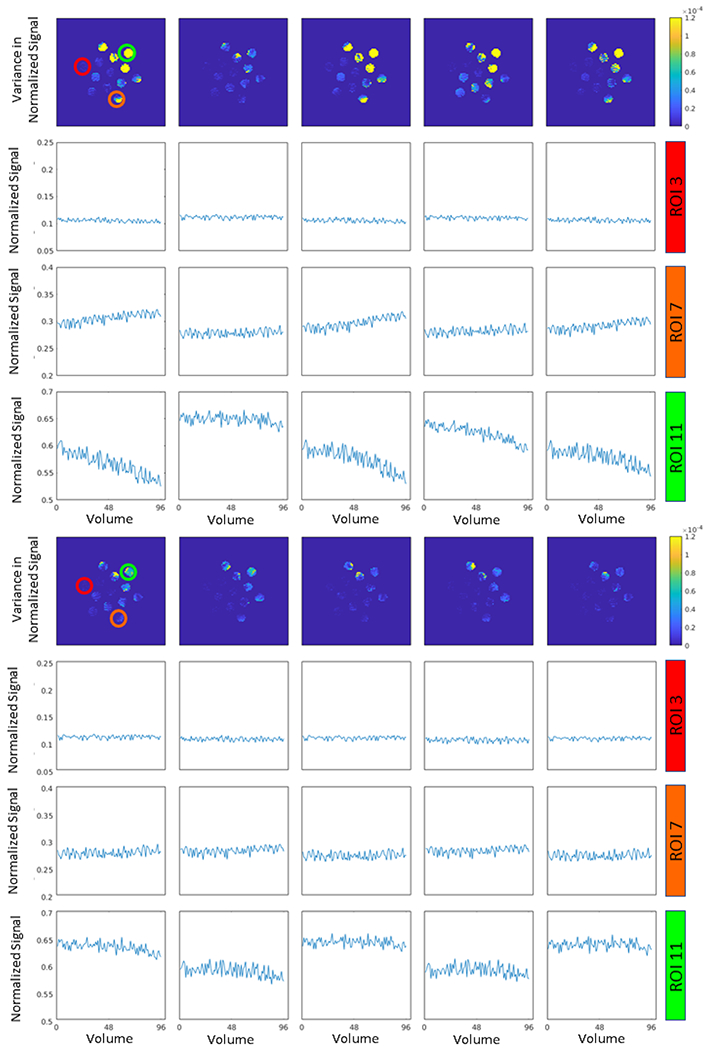
Figure 1.

Empirical characterization of drift in the ice water phantom. This plot presents the variance in the ice water phantom in 10 different scans over the course of the session (1st and 4th row) and normalized signal intensity within three ROIs (indicated in the top left plot). The top four rows represent the first five scans in the series with the bottom four representing the last five scans. Note that areas of high variance in the top plot row correspond to ROI’s that have greater drift and require more substantial calibration. Of concern, observe that different ROI’s within same scan are drifting with opposite signs, hence spatial correction of the signal drift is required. Furthermore, over the course of the session, the pattern of drift changes with time and with region. This complex drift pattern is motivation for the proposed spatial-temporal drift correction model, TS.
