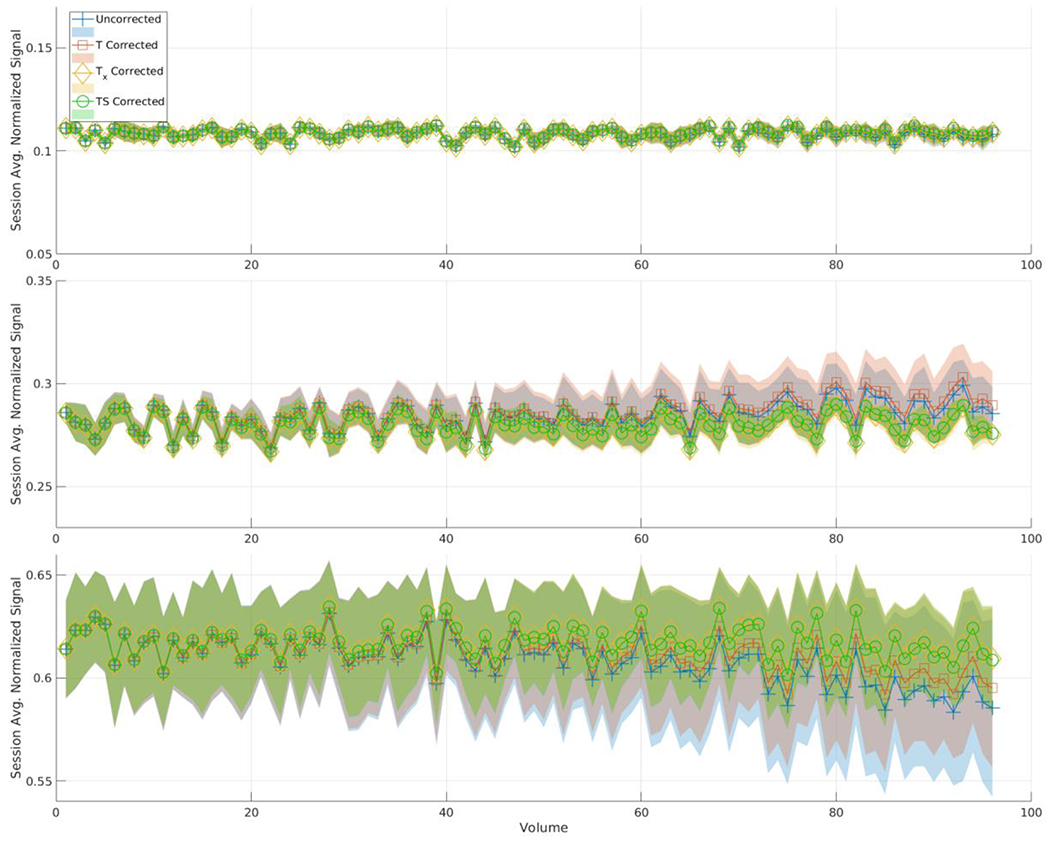
Figure 4 .

This plot represents the mean signal across the 10 scans in the session for the ice-water phantom for each method. Each line also has a shaded area representing the standard deviation among those scans at each volume number. Each plot represents one of the three selected ROIs from Figure 1. From top to bottom those ROIs are 3, 7, and 11. In ROI 3 there is no difference between the methods, but in the ROIs that show higher variance in Figure 1, the uncorrected method and T deviate from Tx and TS.
