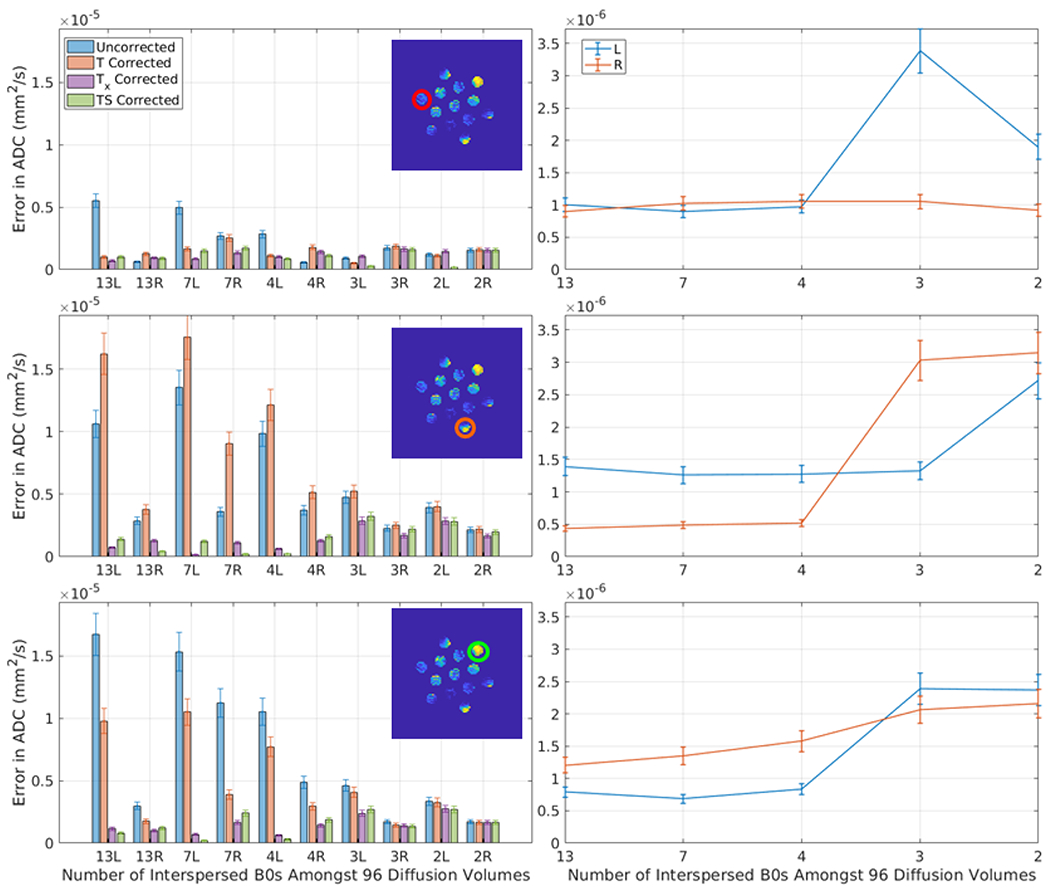
Figure 6.

This plot presents the average error in ADC (standard deviation in a 3rd degree polynomial fit to the mean ADC of an ROI over the course of a scan) after correction for each of the five methods for 10 consecutive sessions using the ice water phantom with varying numbers of interspersed minimally weighted (“b0”) volumes (labeled in the x-axis). The appended letter of the x-axis label indicates the phase encoding direction (L = rll R= rlr). The three rows correspond to the three ROI’s in Figure 1, as indicated. The left column presents a comparison of the five methods. In the low variance ROI (first row), overall errors are small and little difference is observed between methods. In the two ROIs of higher variance, Tx, and TS outperform T for all scans. Note that in some scans, the uncorrected method out performs the T corrected scans. The right column studies simulated rate of b0 volumes by dropping out the b0s from the first two scans. Observe that with at least 4 b0s, the model errors are stable and low, which is intuitive as a second degree model is fit for #b0s>3 and a first degree model is fit for #b0<=3.
