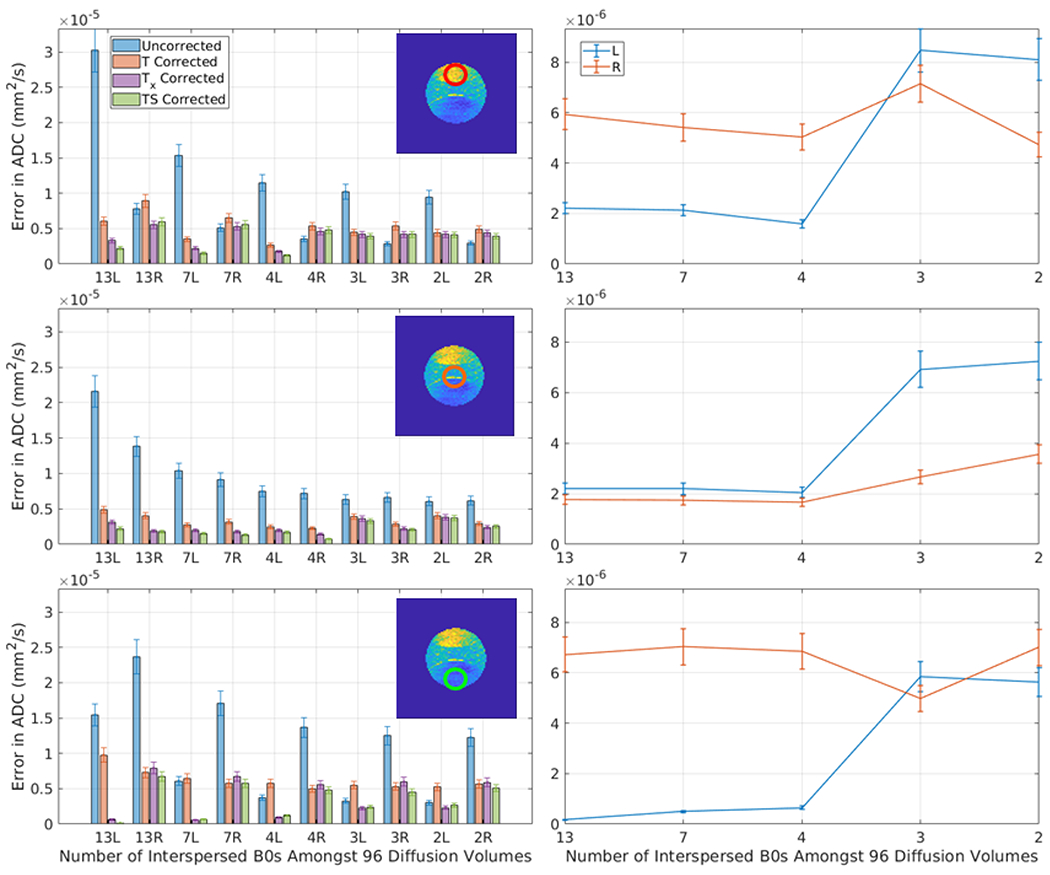
Figure 7.

This plot presents the error in ADC (standard deviation in a 3rd degree polynomial fit to the mean ADC of an ROI over the course of a scan) after correction for each of the five methods for 10 consecutive sessions using the PVP phantom with varying numbers of interspersed minimally weighted (“b0”) volumes (labeled in the x-axis). The appended letter of the x-axis label indicates the phase shift direction (L = rll R= rlr). The three rows correspond to the three ROI’s in Figure 1, as indicated. The left column presents a comparison for the five methods. In the middle ROI (second row) T, Tx, and TS show very similar performance as the drift in the center ROI is similar to the average drift across all ROIs. In the outer two ROIs (especially row 3) Tx and TS shows significant improvements over T. The right column studies simulated rate of b0 volumes by dropping out the b0s from the first two scans. Observe that with at least 4 b0s, the model errors are stable and low, which is intuitive as a second degree model is fit for #b0s>3 and a first degree model is fit for #b0<=3.
