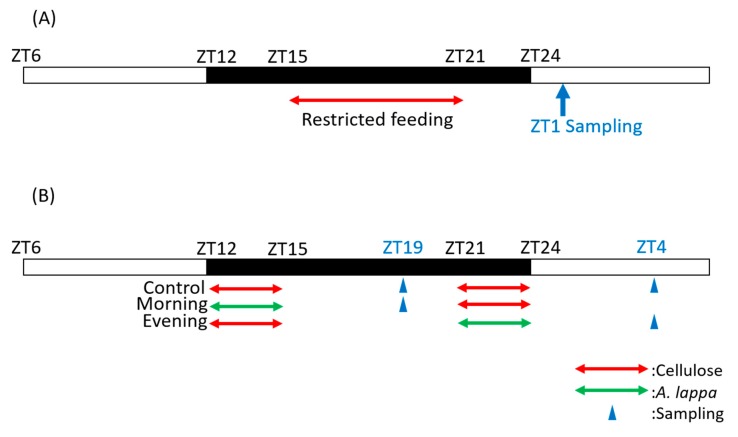
Figure 1.
Experimental schedule. (A) Scheduling in experiment 1, and (B) scheduling in experiments 2 and 3. The white and black bars indicate environmental 12 h light and 12 h dark conditions. The red arrow indicates the feeding time with cellulose and green arrow indicates the feeding time with A. lappa. The blue arrow indicates the sampling time. In Experiment 1, mice were fed with each food from ZT15 to ZT21 and sacrificed at ZT1. In Experiments 2 and 3, the mice were fed with each food from ZT12 to ZT15 as morning intake and from ZT21 to ZT24 as evening intake and were sacrificed at ZT19 or ZT4.

