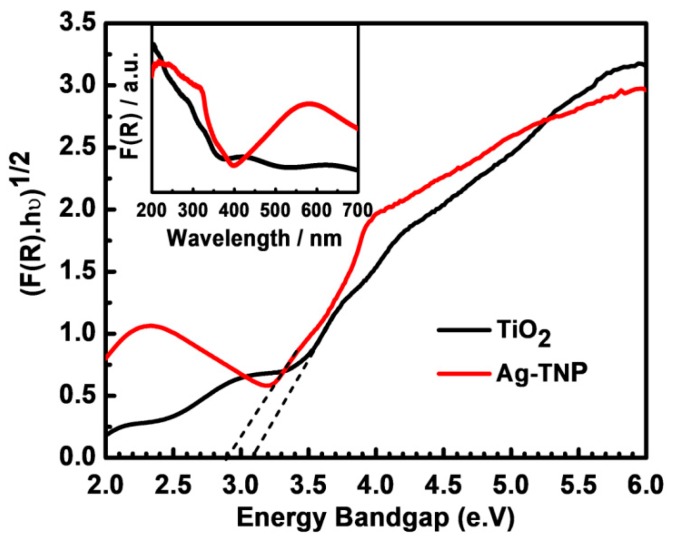
Figure 4.
The diffusive reflectance analysis of as-prepared TiO2 and Ag modified TiO2 hybrids to obtained Tauc’s plot for an indirect bandgap model (Kubelka–Munk function). The red line belongs to Ag-TNP hybrids, and the black line belongs to unmodified TiO2 nanoparticles. The dash-dot lines represent the tangent line towards the point, where the line intersects the horizontal energy axis (bandgap). The inset graph shows the enlarged version of the bandgap model study.

