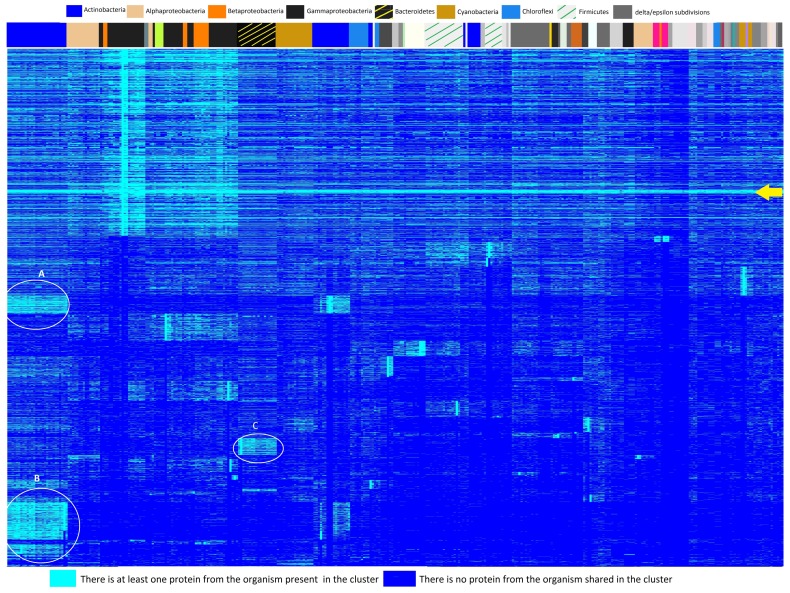
Figure 1.
A heatmap of protein sequence cluster membership together with hierarchical clustering results for the 360 organisms. The heatmap assists in understanding the cluster results. Each row indicates a cluster, and each column represents an organism. Cyan represents membership in a protein cluster while blue indicates absence. The legend of phyla at the top of the figure shows the largest clades represented by colored bands immediately above the heatmap. On the left side of the dendrogram we find Actinobacteria, with distinct blocks of clusters indicated by cyan (A and B in the figure). Bacteroidetes (black with yellow lines) also has blocks of protein clusters (C in the figure). The yellow arrow indicates the band of protein clusters broadly conserved across the phyla.

