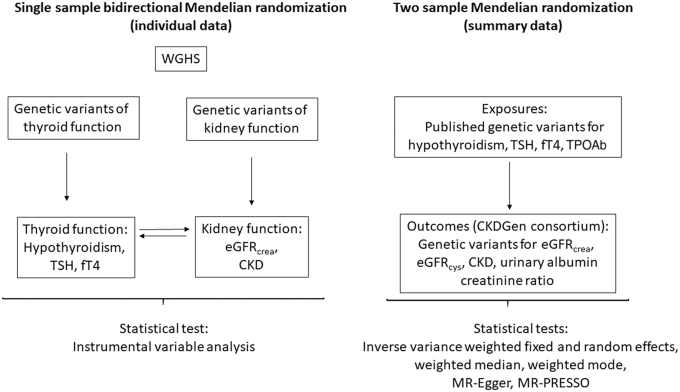
FIG. 1.
Flowchart representing the main design in the MR of thyroid and kidney function. CKDGen, Chronic Kidney Disease Genetics Consortium; eGFRcrea, estimated glomerular filtration rate from creatinine [in ln(mL/min/1.73 m2)]; eGFRcys, estimated glomerular filtration rate from cystatin C [in ln(mL/min/1.73 m2)]; fT4, free thyroxine (per SD); MR, Mendelian randomization; MR-PRESSO, Mendelian randomization pleiotropy residual sum and outlier; SD, standard deviation; TPOAb, thyroid peroxidase antibody (per SD); TSH, thyrotropin (per SD); WGHS, Women's Genome Health Study.

