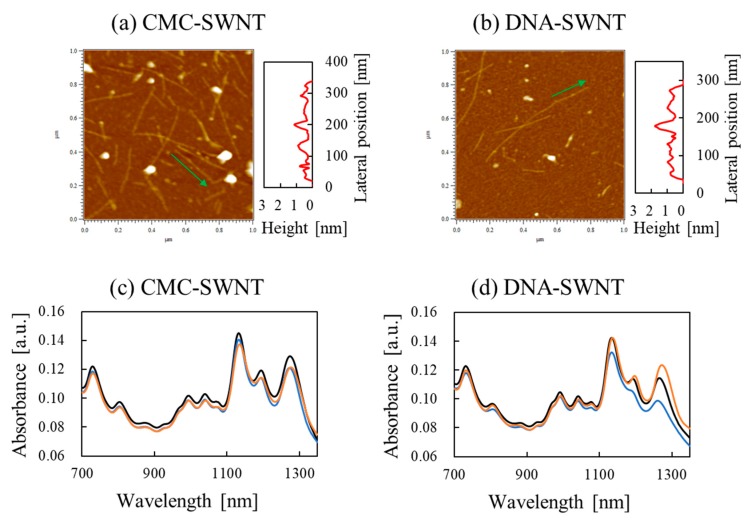
Figure 3.
AFM images: (a) CMC–SWNTs, (b) dsDNA–SWNTs. NIR absorption spectra of SWNT composites: (c) CMC–SWNTs, (d) dsDNA–SWNTs. Black line: SWNT composites initially prior to adding H2O2. Blue line: SWNT composites oxidized with 0.03% H2O2 solution for 30 min. Orange line: the oxidized SWNT composites were incubated with 15 μg/mL catechin solution for 10 min. The absorption values represent the average of five independent measurements. The results of Figure 3 were measured by co-author R. Hamano.

