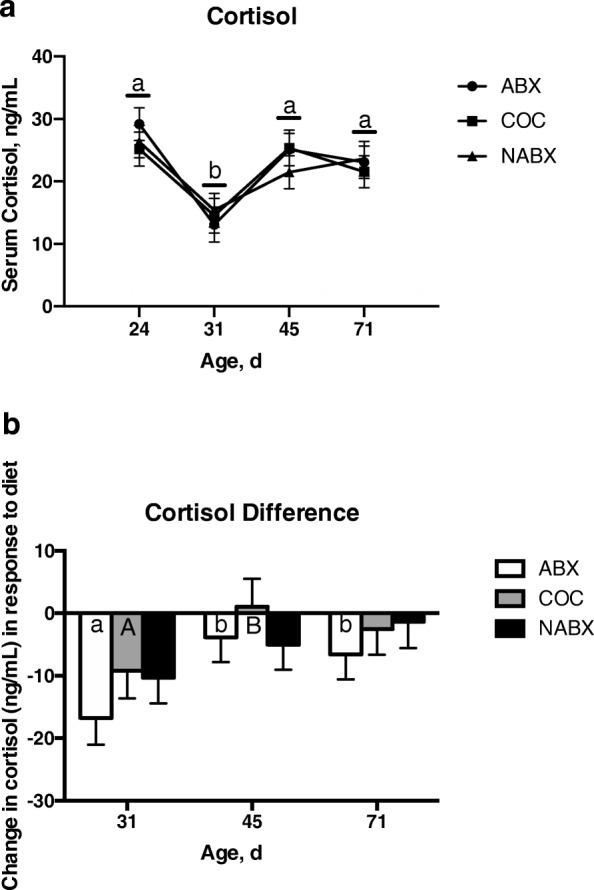
Fig. 2.

Effect of diet treatment on serum cortisol. a Cortisol levels in each diet treatment group ABX, COC, and NABX) over time. b Change in cortisol levels in response to diet over time. Values for the change in glucose or insulin were normalized to individual animal baseline (d24) measurements and then averaged across treatment groups for each age (d31, d45, d71). Within diet treatment but between age, points or bars with different lowercase letters denote significant differences between ages (P < 0.05) and bars with different uppercase letters denote a trend toward significant differences between ages (0.05 < P < 0.10)
