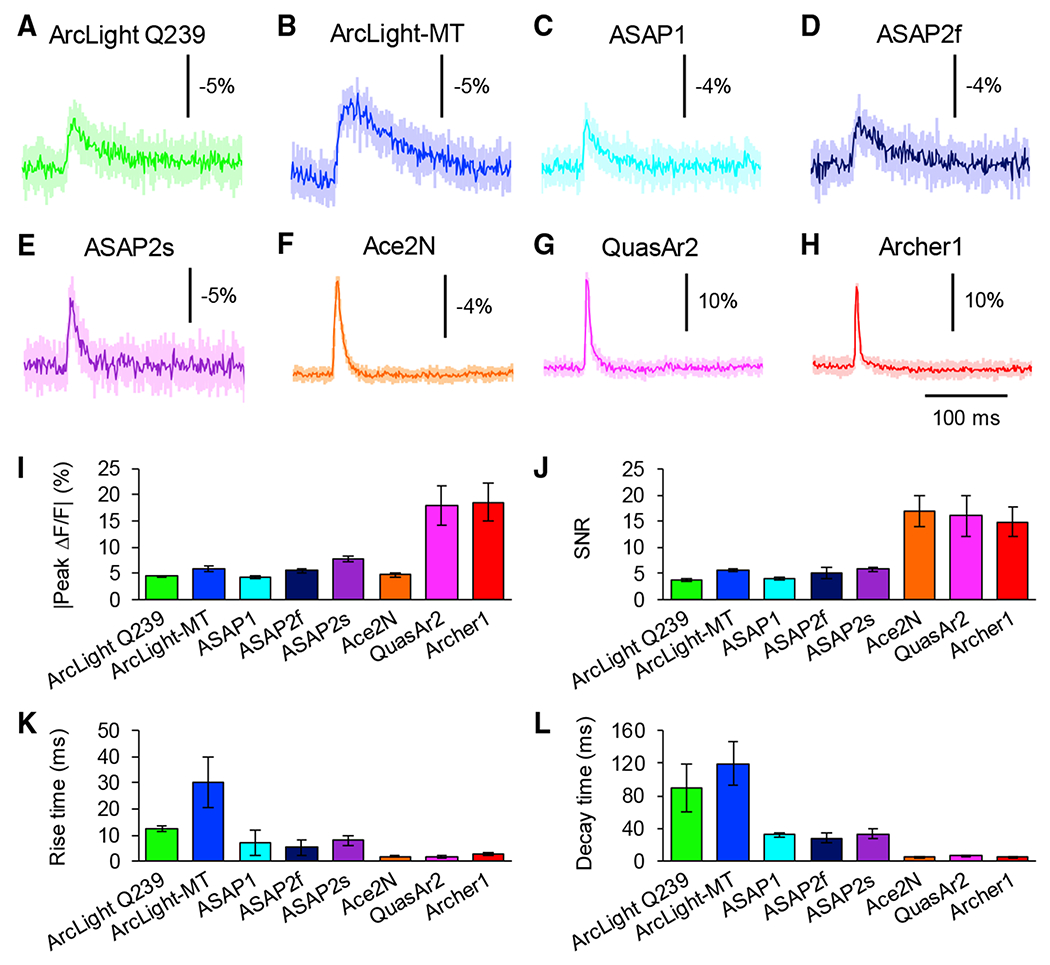
Figure 2. Imaging Single Action Potential Responses In Vitro.

(A–H) Average optical waveform of ArcLight Q239 (A), ArcLight-MT (B), ASAP1 (C), ASAP2f (D), ASAP2s (E), Ace2N-4AA-mNeon (F), QuasAr2 (G), and Archerl (H) in response to single action potentials induced by current injections. Ten trials were averaged for each neuron. Shaded areas represent the SD of the mean.
(I–L) Comparison of GEVIs’ peak amplitude (I), SNR (J), rise time (K), and decay time (L) of ArcLight Q239 (n = 5 cells), ArcLight-MT (n = 6 cells), ASAP1 (n = 6 cells), ASAP2f (n = 5 cells), ASAP2s (n = 6 cells), Ace2N-4AA-mNeon (n = 5 cells), QuasAr2 (n = 5 cells), and Archerl (n = 5 cells).
Means ± SEMs are presented.
See also Figures S1, S2, and S3.
