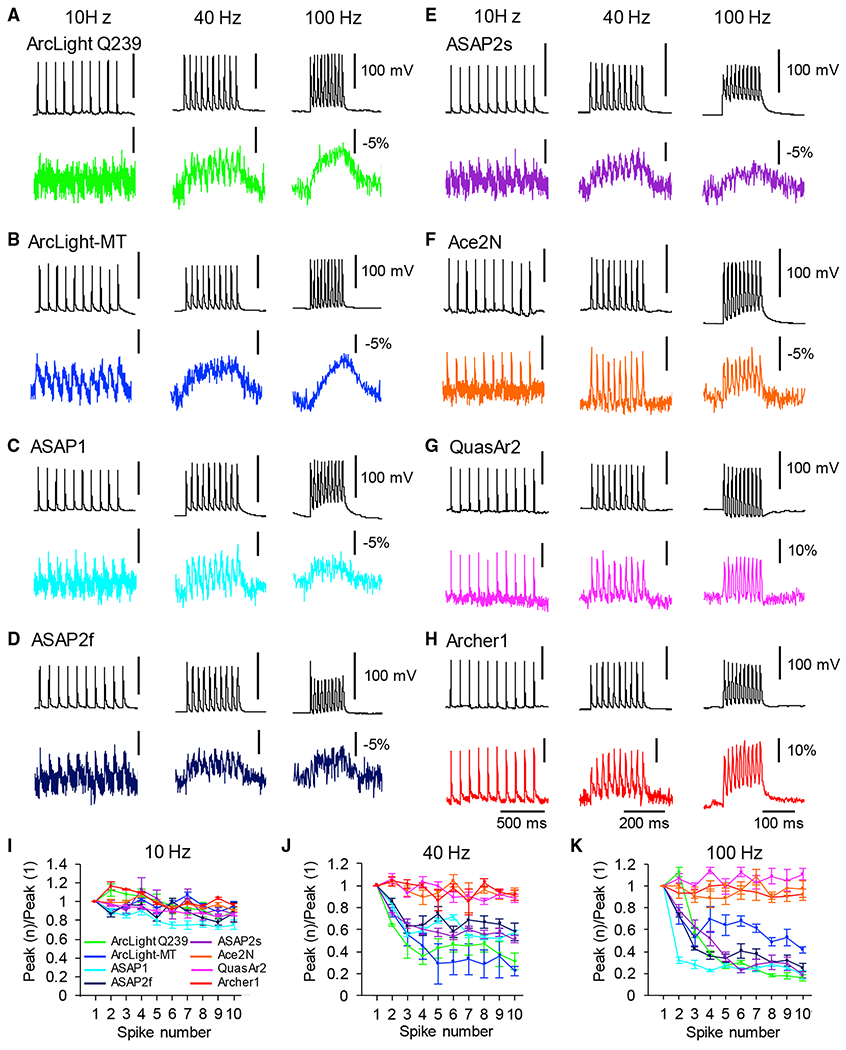
Figure 3. Imaging Spike Trains Responses of GEVIs In Vitro.

(A–H) Representative single electrical (top) and optical traces (bottom) in response to 10 Hz (left), 40 Hz (center), and 100 Hz (right) series of 10 action potentials. Optical traces of ArcLight Q239 (A), ArcLight-MT (B), ASAP1 (C), ASAP2f (D), ASAP2s (E), Ace2N-4AA-mNeon (F), QuasAr2 (G), and Archer1 (H) are shown.
(I–K) Ratio of peak amplitude of GEVIs’ responses (means ± SEMs) as a function of spike number during trains of spikes evoked at 10 Hz (I), 40 Hz (J), and 100 Hz (K) (n = 10 trials of each GEVI).
