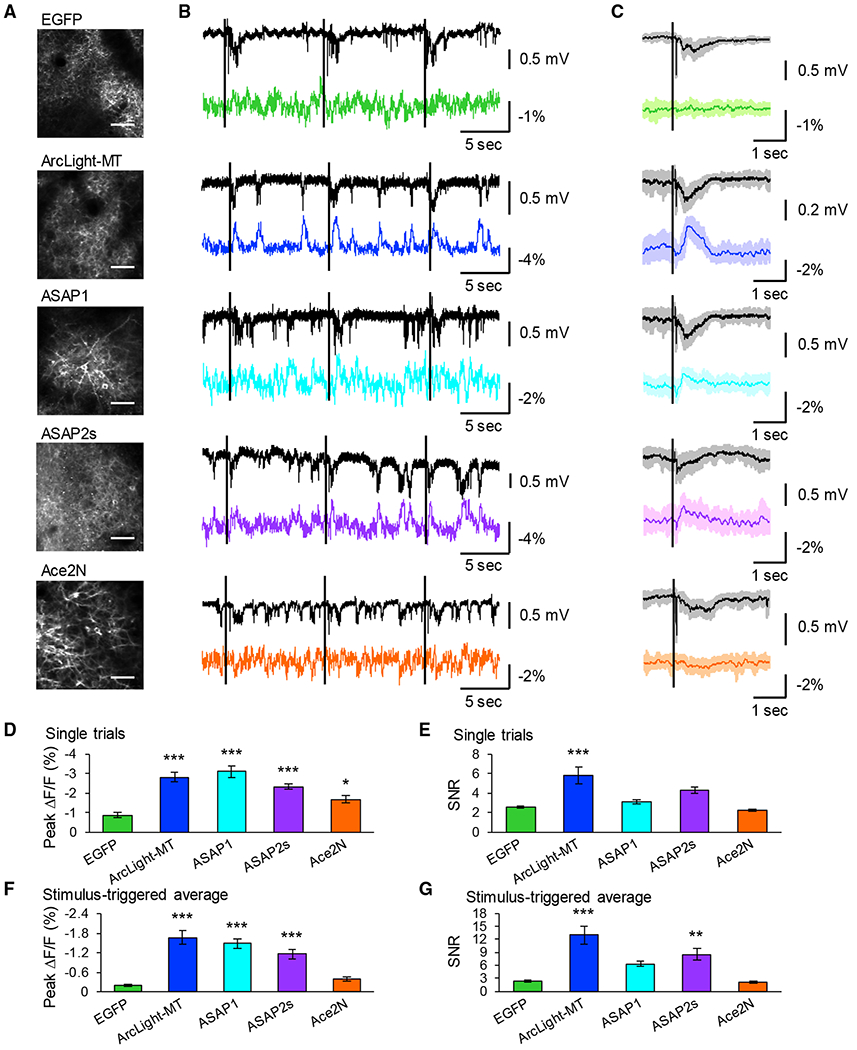
Figure 7. Two-Photon Optical Field Potential Imaging with GEVIs.

(A) Two-photon images of primary visual cortex expressing GEVIs. Scale bar, 50 μm.
(B) Representative traces of LFPs (black traces) and OFPs (colored traces). Fluorescent changes were imaged from all FOVs as a population. Black lines indicate the timing of the visual stimuli.
(C) Average LFP (black traces) and optical waveform (colored traces) in response to visual stimuli over 10 trials, with shaded areas representing SD of the mean. The black lines indicate the timing of the visual stimuli.
(D and E) Peak amplitude (D) and SNR (E) of single trials. Means ± SEMs are presented.
(F and G) Peak amplitude (F) and SNR (G) of stimulus-triggered average. Means ± SEMs are presented, n = 10 FOVs from 5 mice (EGFP), 11 FOVs from 6 mice (ArcLight-MT), 9 FOVs from 7 mice (ASAP1), 9 FOVs from 4 mice (ASAP2s), and 12 FOVs from 6 mice (Ace2N-4AA-mNeon).
**p < 0.01, ***p < 0.001 compared with EGFP. Dunnett test. See also Figure S7.
